University of Minnesota, Griffis lab. 2022, rebuilt 2026.
Forecasting and reconstructing monthly methane flux at Marcell Bog Lake Peatland
Marcell Bog Lake Peatland is a poor fen in north-central Minnesota. A tower there has measured carbon dioxide since 2007 and methane since 2009, at a site with one of the longest-running peatland monitoring programs. This project asks two questions of it. How far ahead can monthly flux be forecast from the tower's own history and four measured drivers (soil temperature, air temperature, precipitation, and water table)? And can relationships learned on the measured years reach back to 1990, when the drivers begin? The answers come from seasonal decomposition, machine learning forecasts tested against simple benchmarks, and a backcast checked for how far it strays from the data it learned on. What the peatland does each year is predictable; how much it does is not, and the record so far cannot say why.
The site
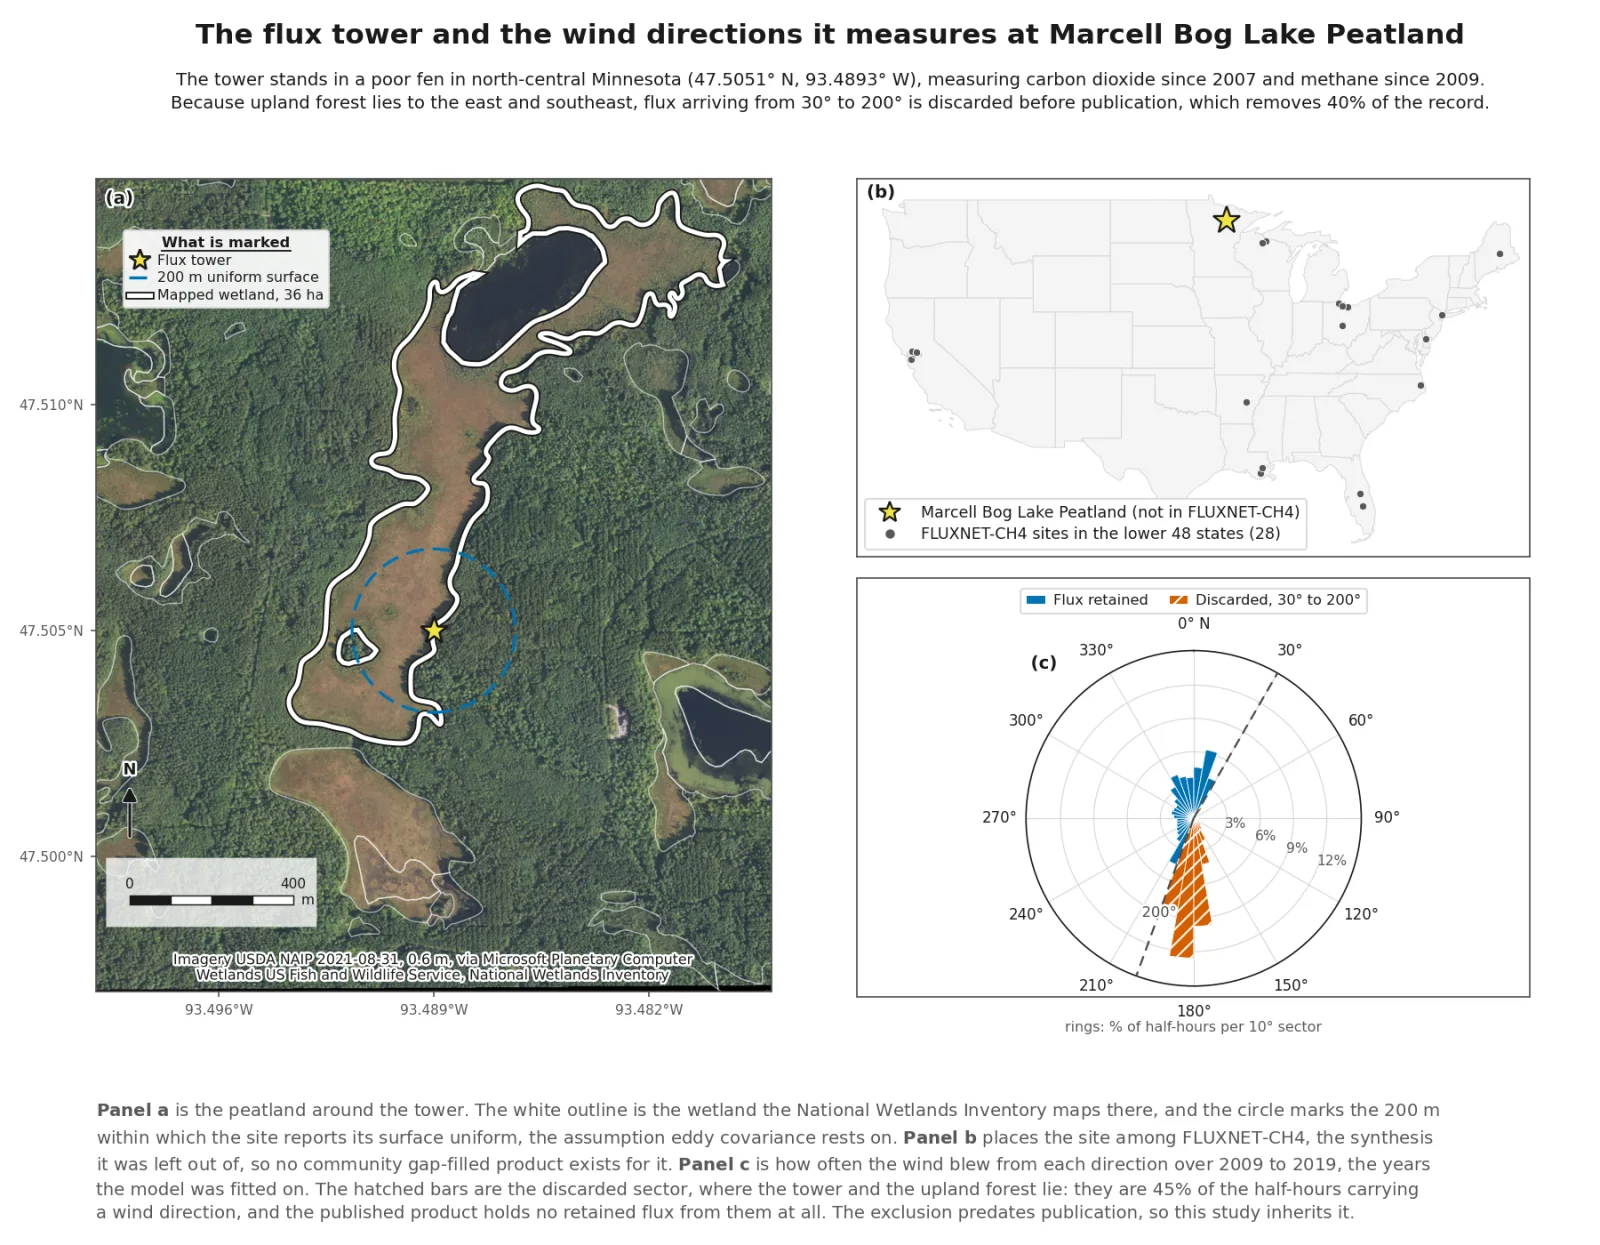
The tower stands in a poor fen at 47.5051 N, 93.4893 W, with upland forest to the east and southeast. Flux arriving from 30 to 200 degrees is discarded before publication, which removes 40 percent of the record. The site was left out of the FLUXNET-CH4 synthesis, so no community gap-filled product exists for it; this study works from the tower's own published record.
The record
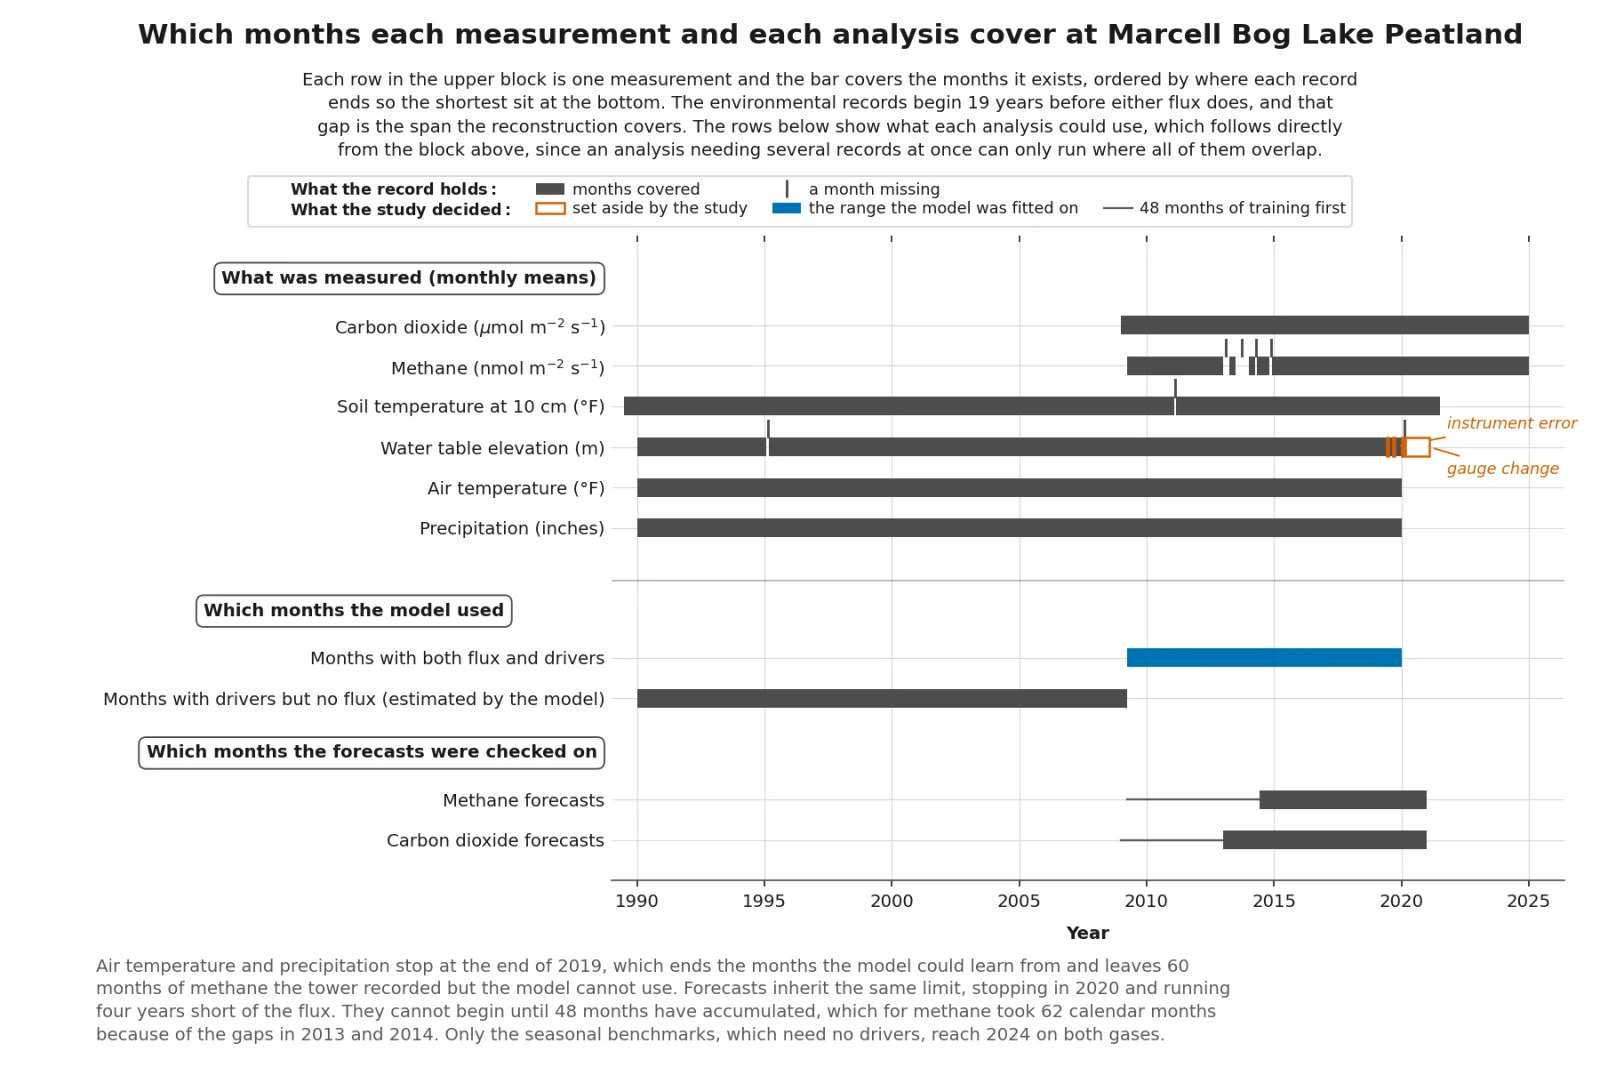
The environmental measurements begin in 1990, nineteen years before either flux record used here does, and that gap is the span the reconstruction covers. Air temperature and precipitation stop at the end of 2019, which ends the months the models could learn from and leaves 60 months of methane the tower recorded but the models cannot use. Forecasts inherit the same limit.
The seasonal shape
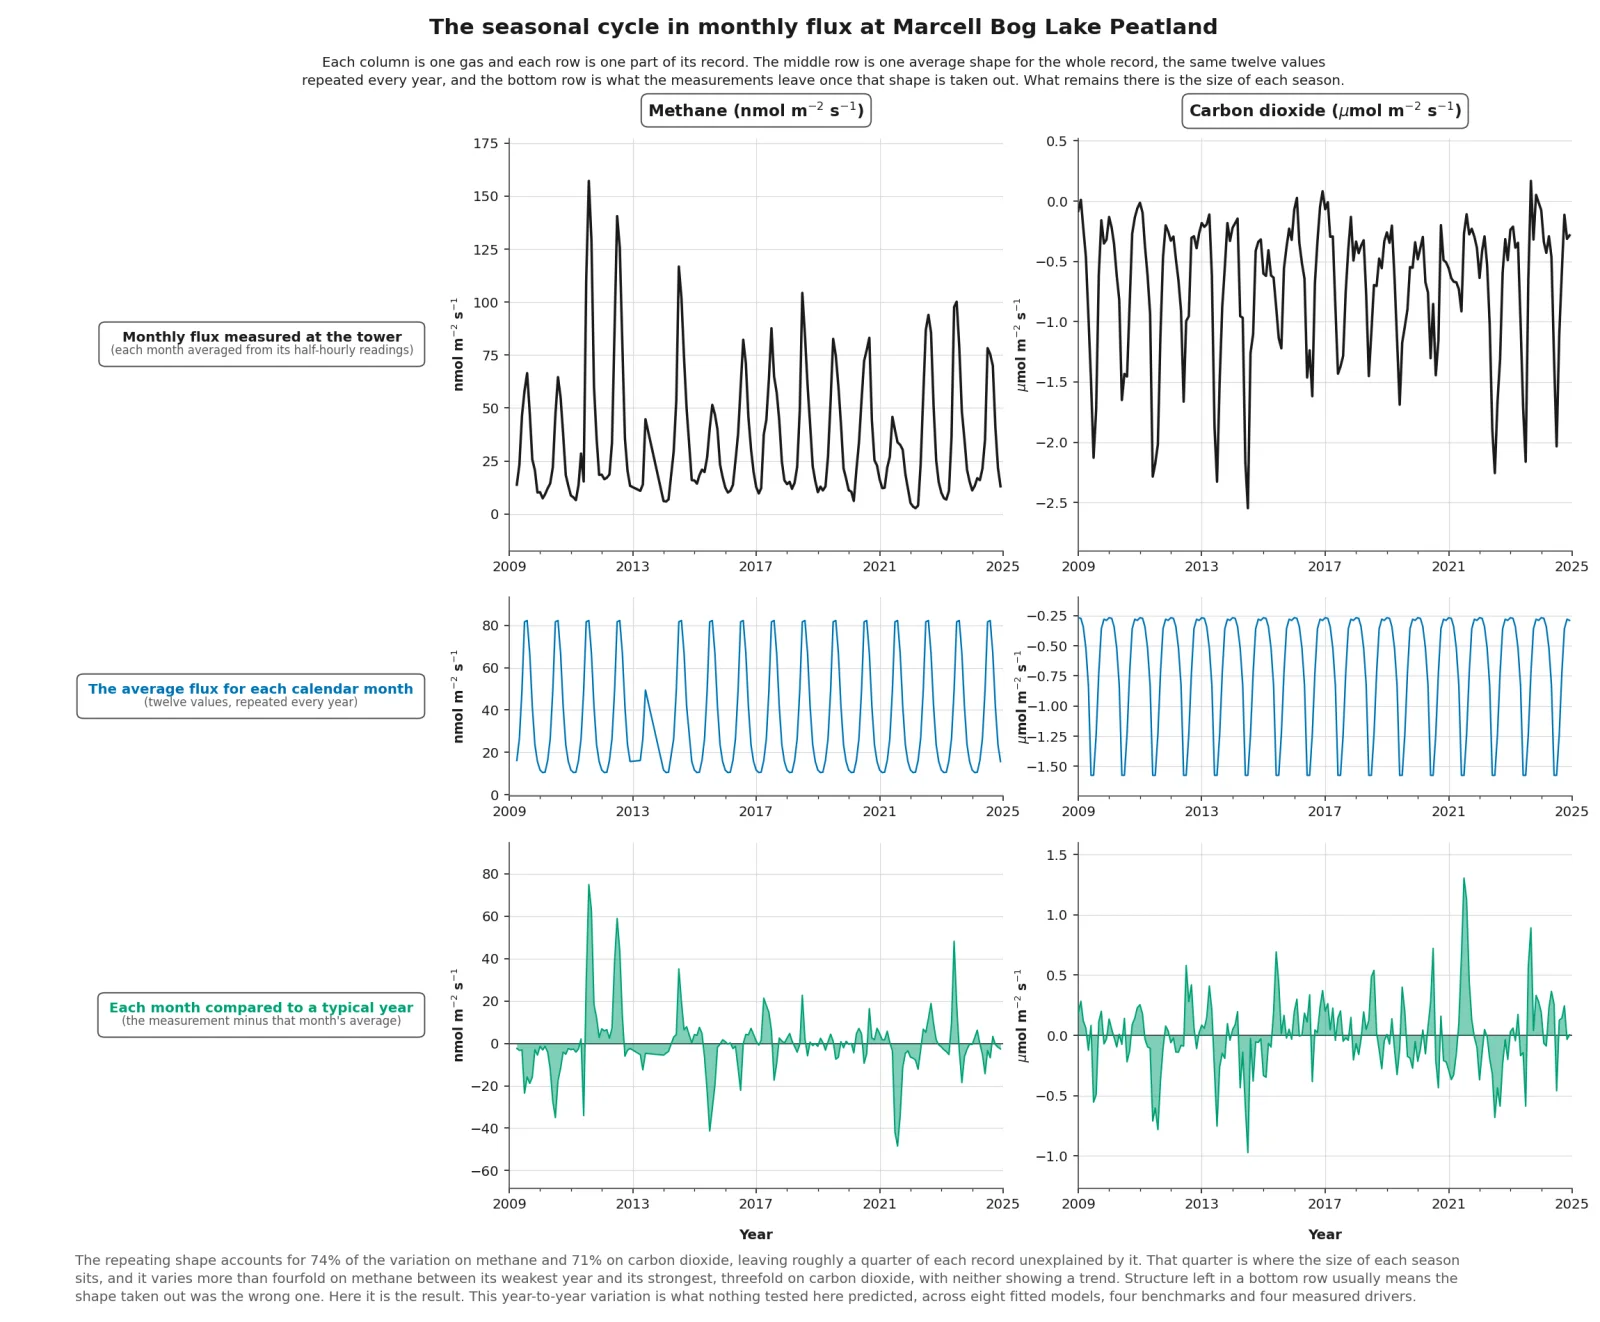
One average shape for the whole record, the same twelve values repeated every year, accounts for 74 percent of the variation in methane and 71 percent in carbon dioxide. What remains is the size of each season, which varies more than fourfold on methane between its weakest year and its strongest, with no trend. That year-to-year variation is what nothing tested here predicted.
Forecasts
Four fitted methods (ordinary least squares, ridge regression, random forest, and gradient boosting), each run with and without lagged drivers, were compared against four benchmarks at horizons from one to twelve months, rebuilt every month as the record grew. The forecasts follow the seasonal cycle closely. What they miss is how large each season will be: in 12 of the 57 evaluated methane months the measured flux fell below every fitted model.
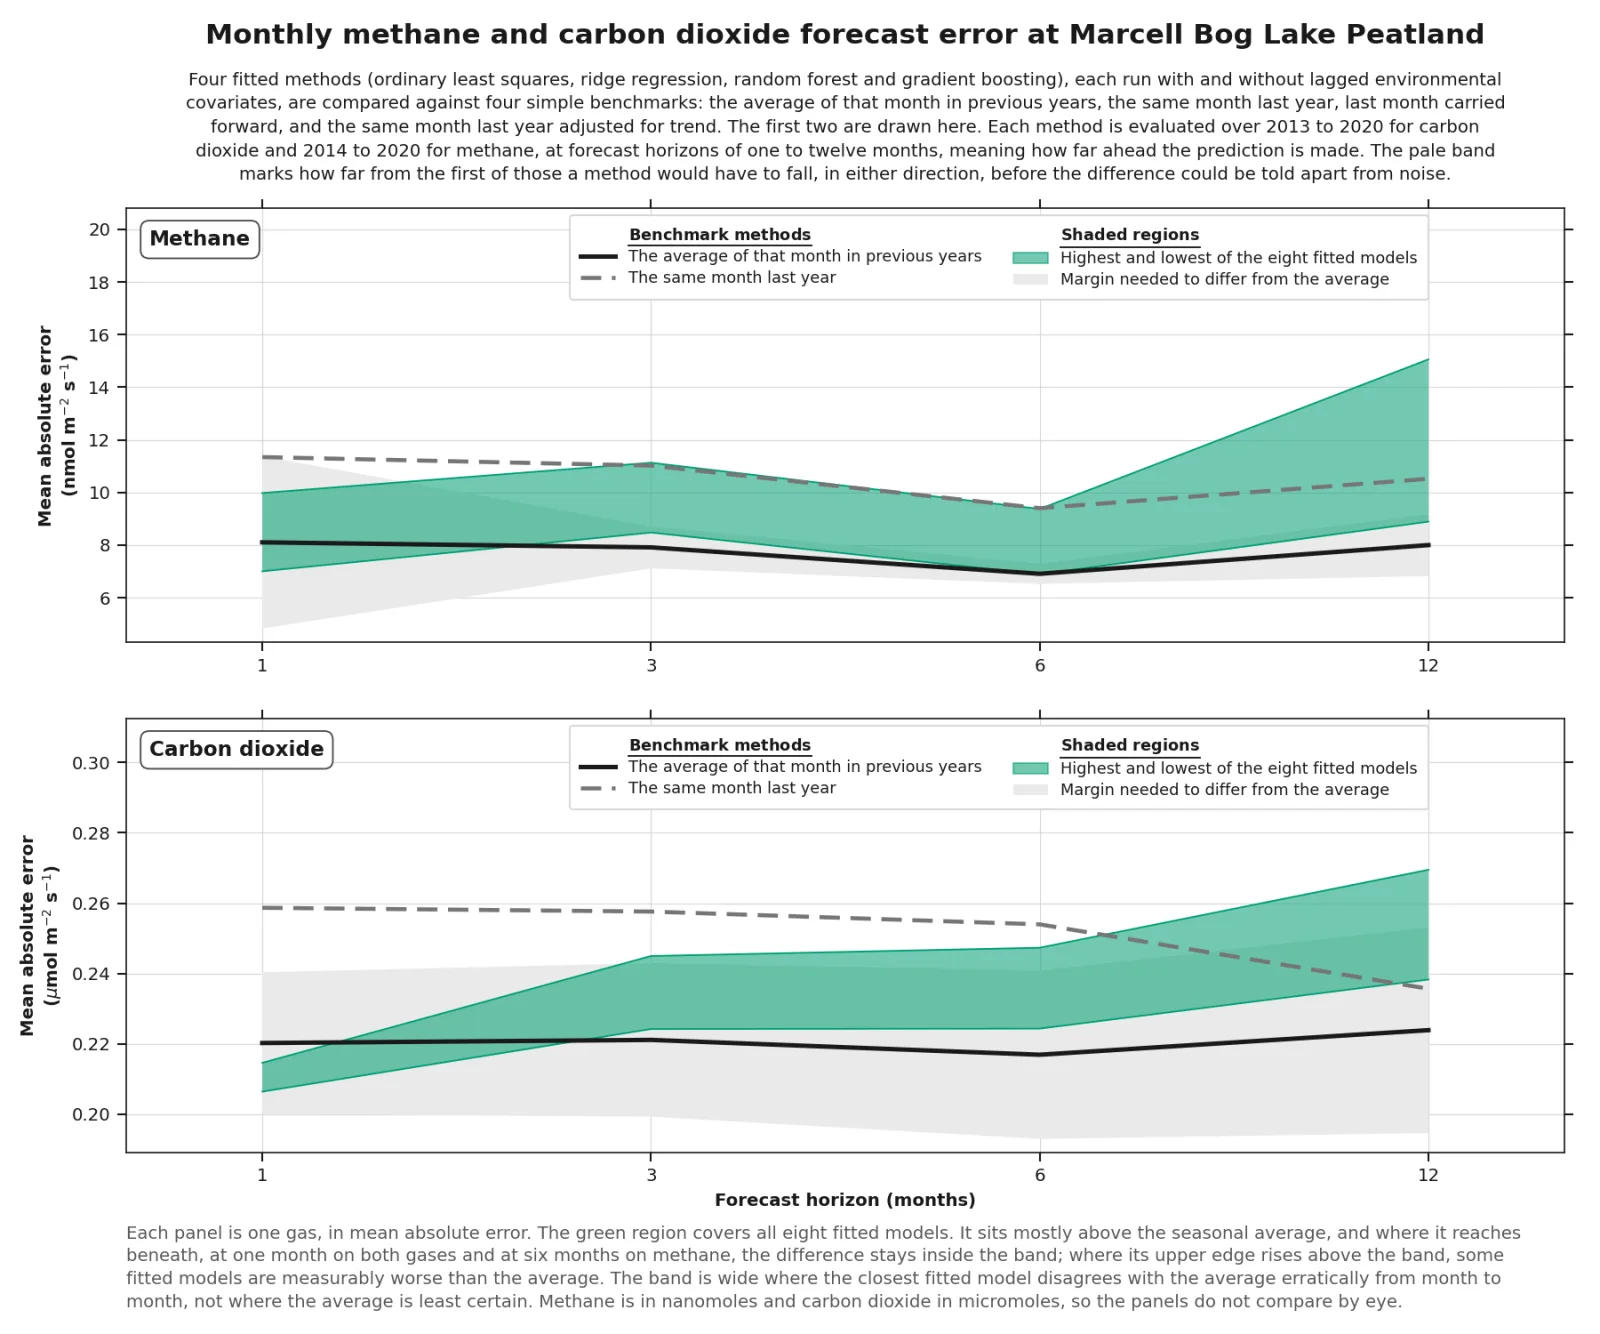
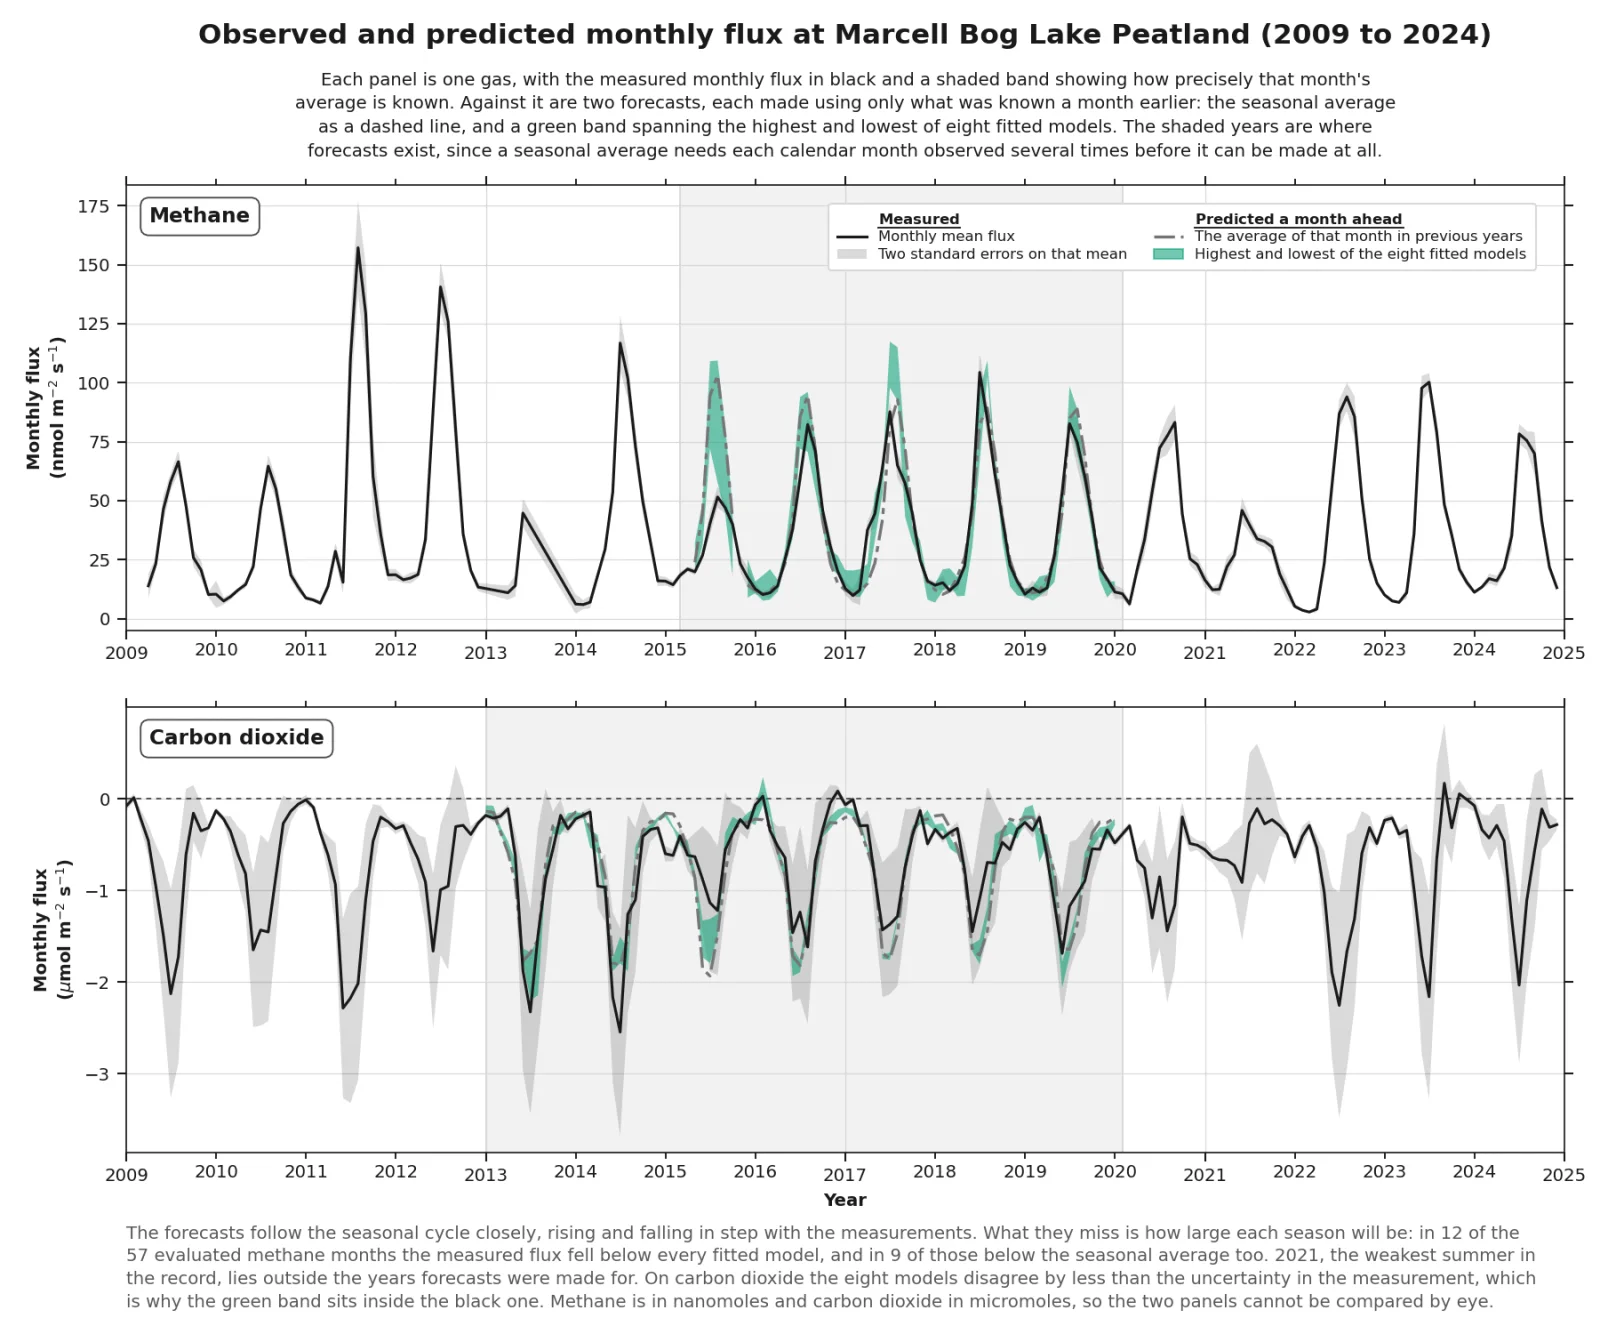
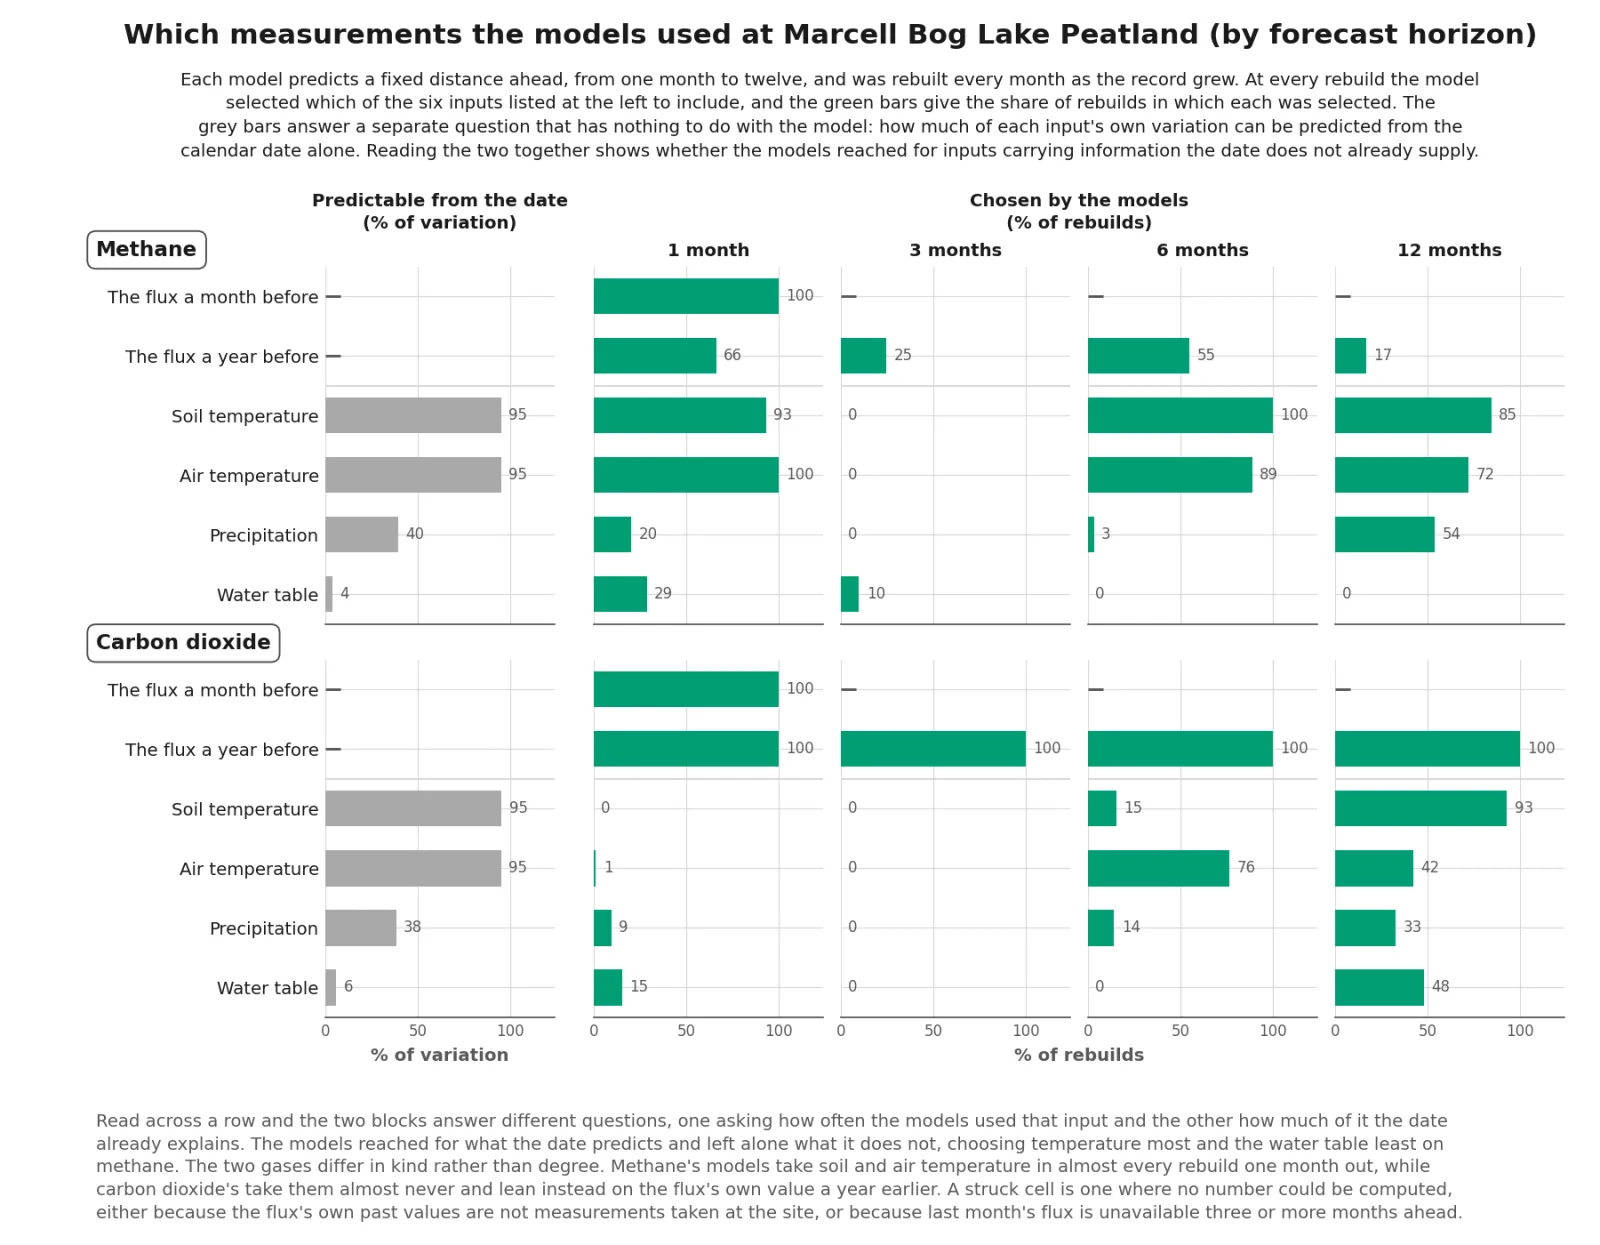
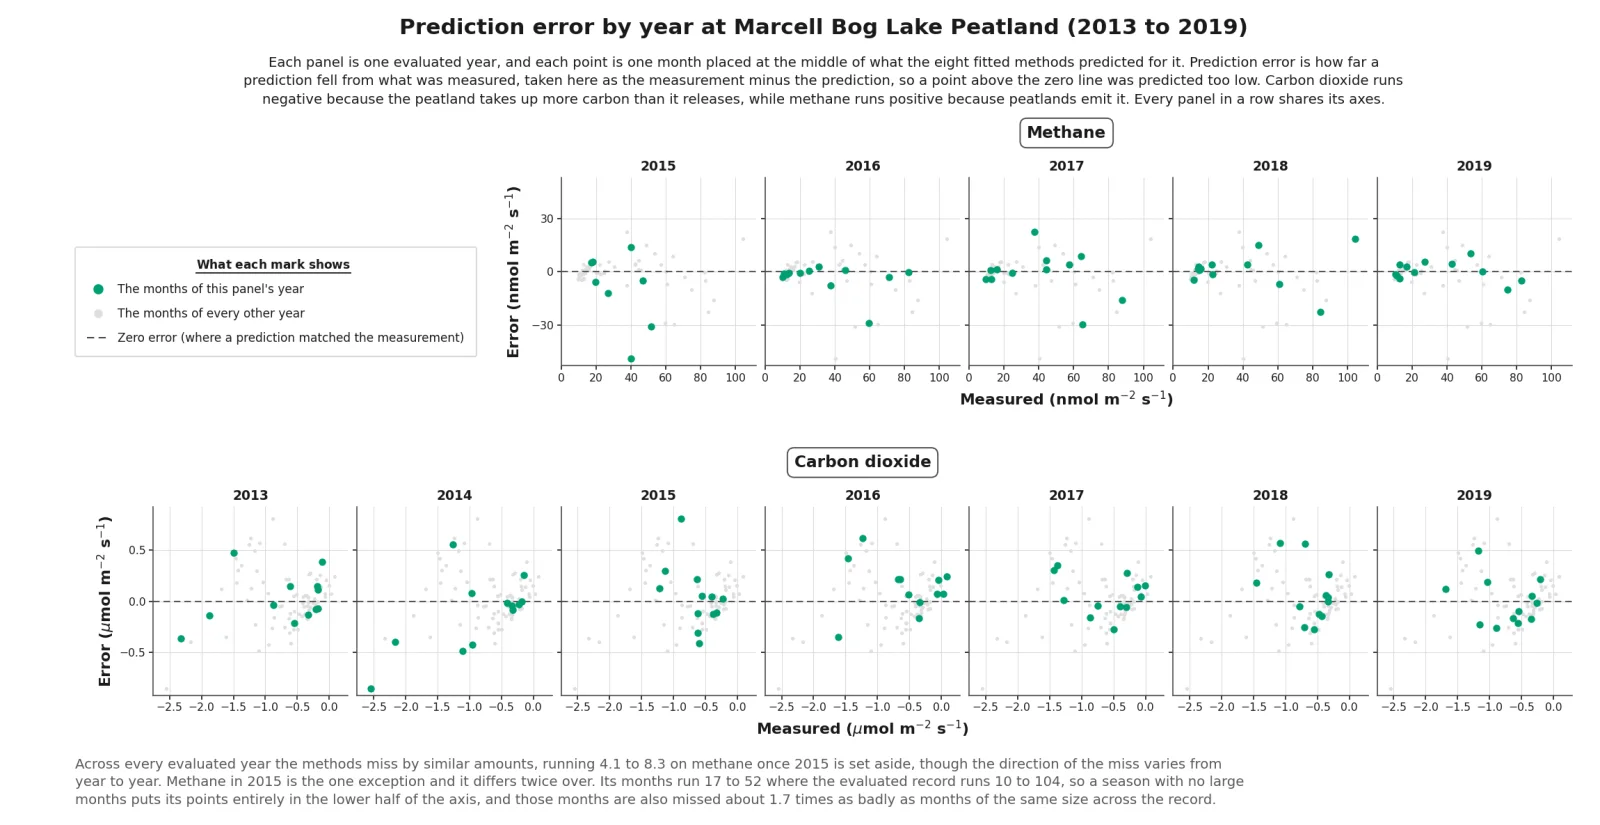
The models reached for what the date already predicts and left alone what it does not, choosing temperature most and the water table least on methane. Across every evaluated year but methane in 2015 the misses are similar in size and vary in direction.
The backcast
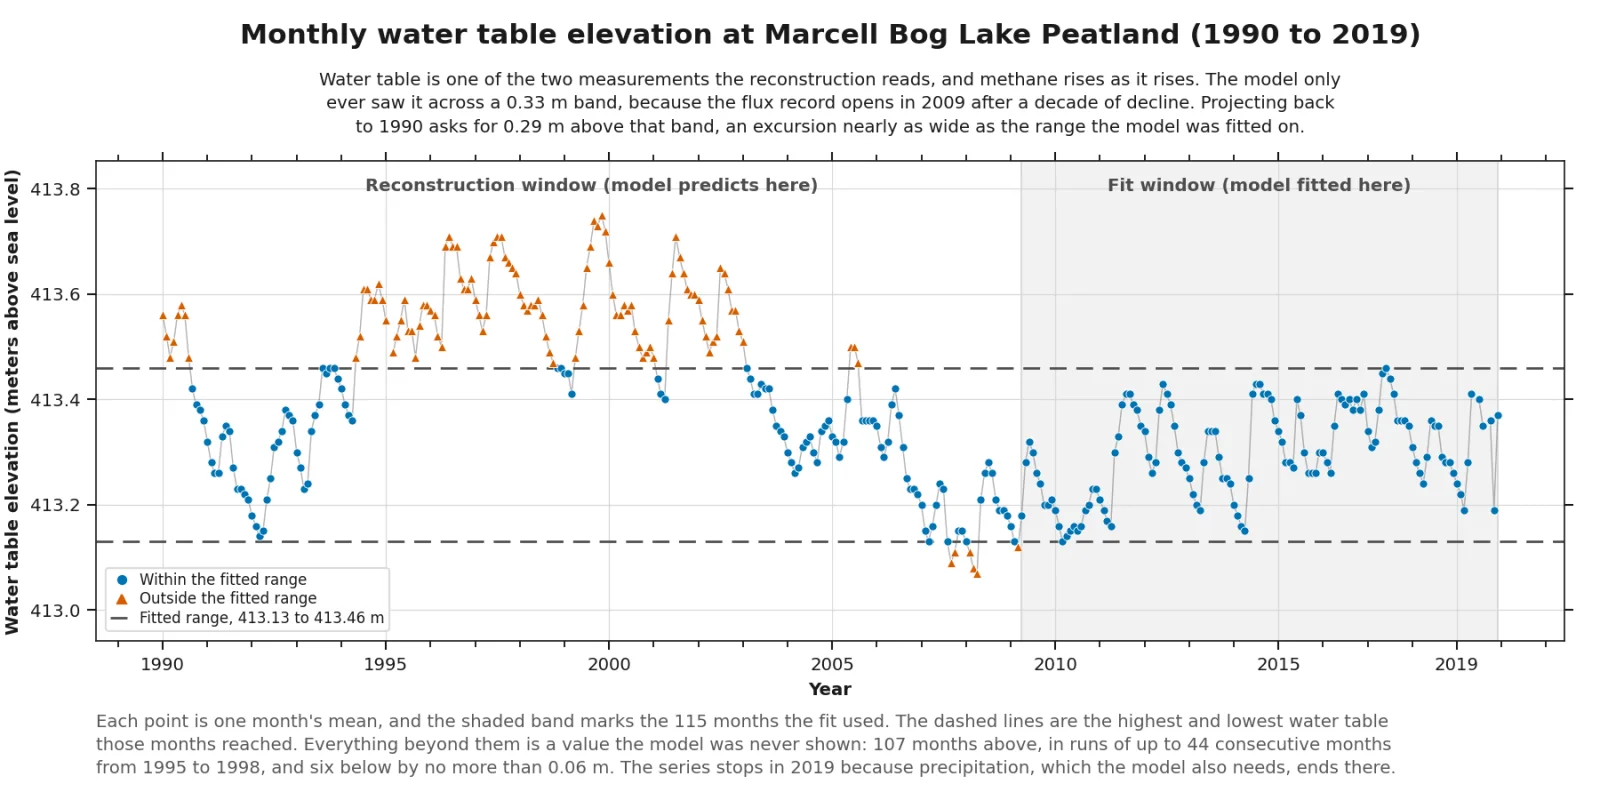
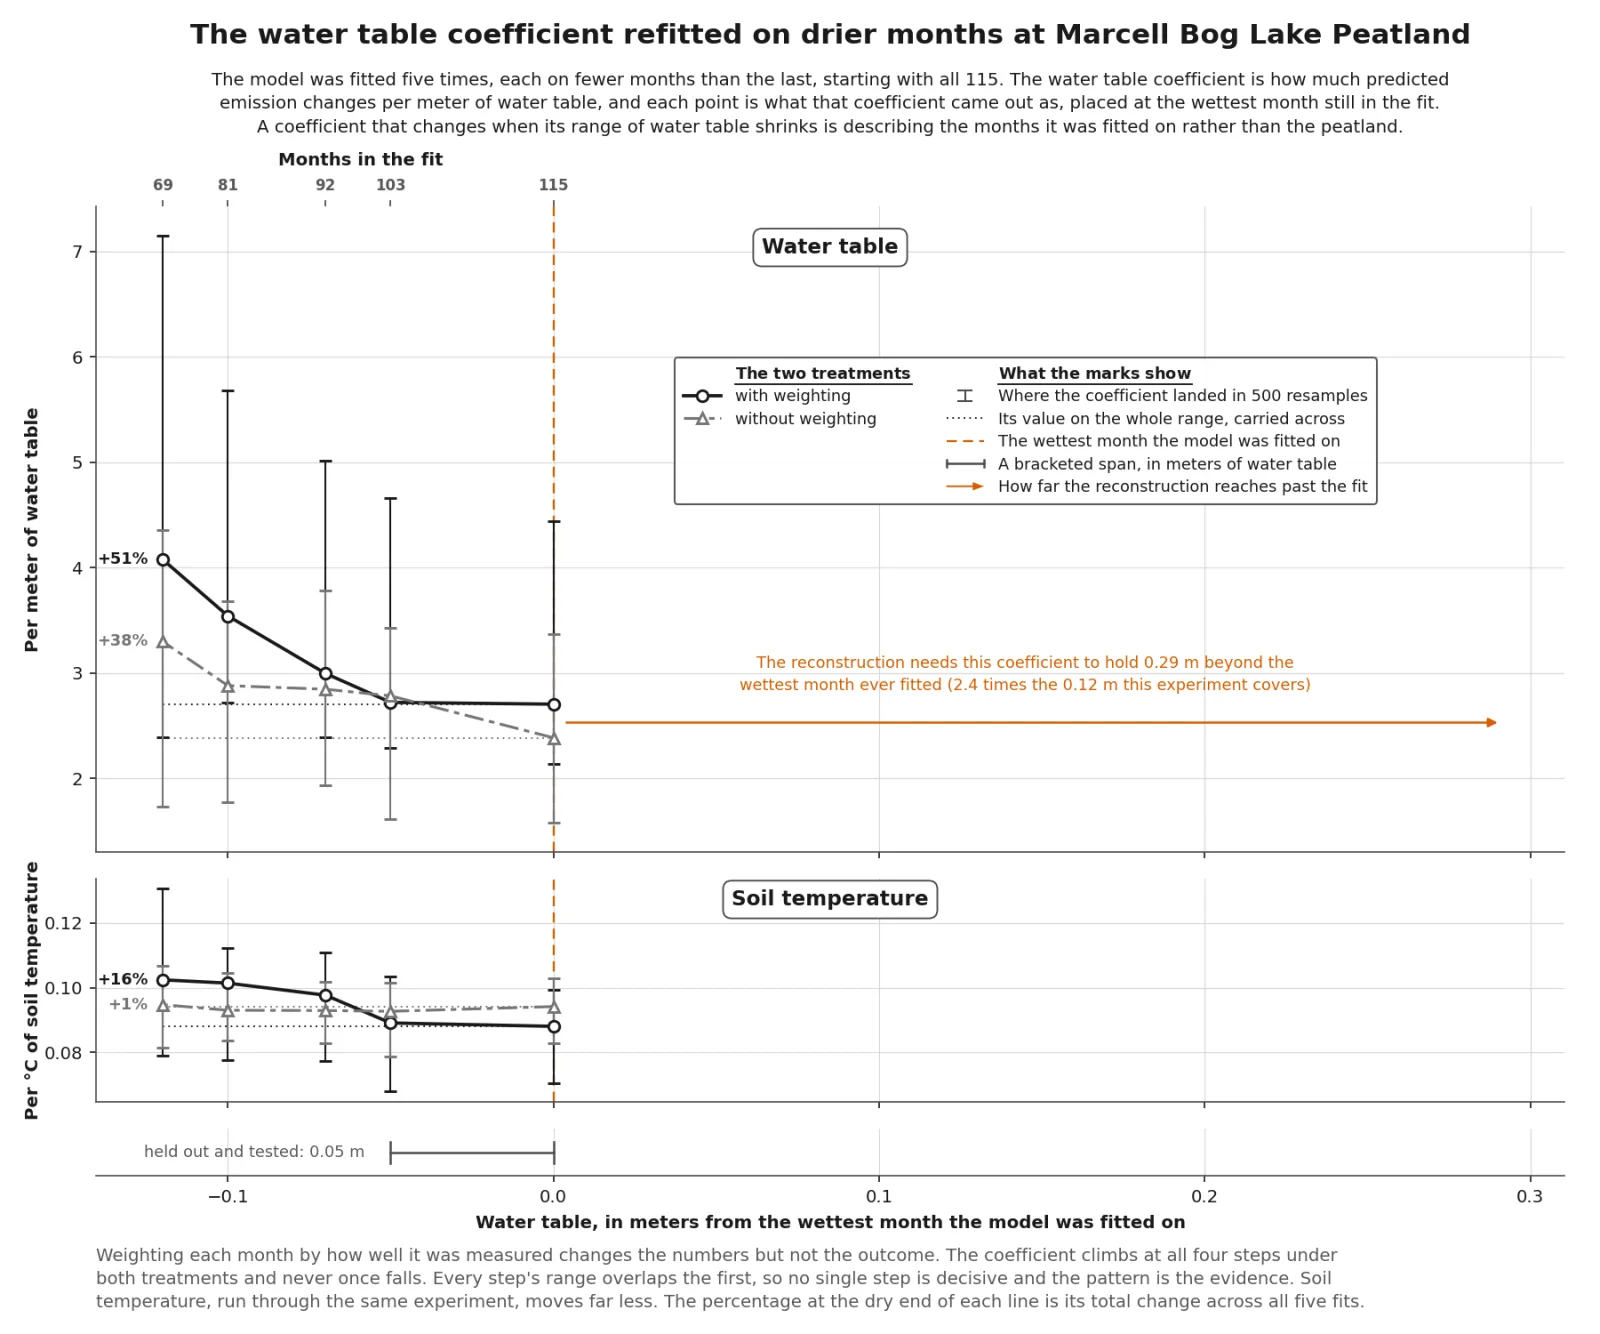
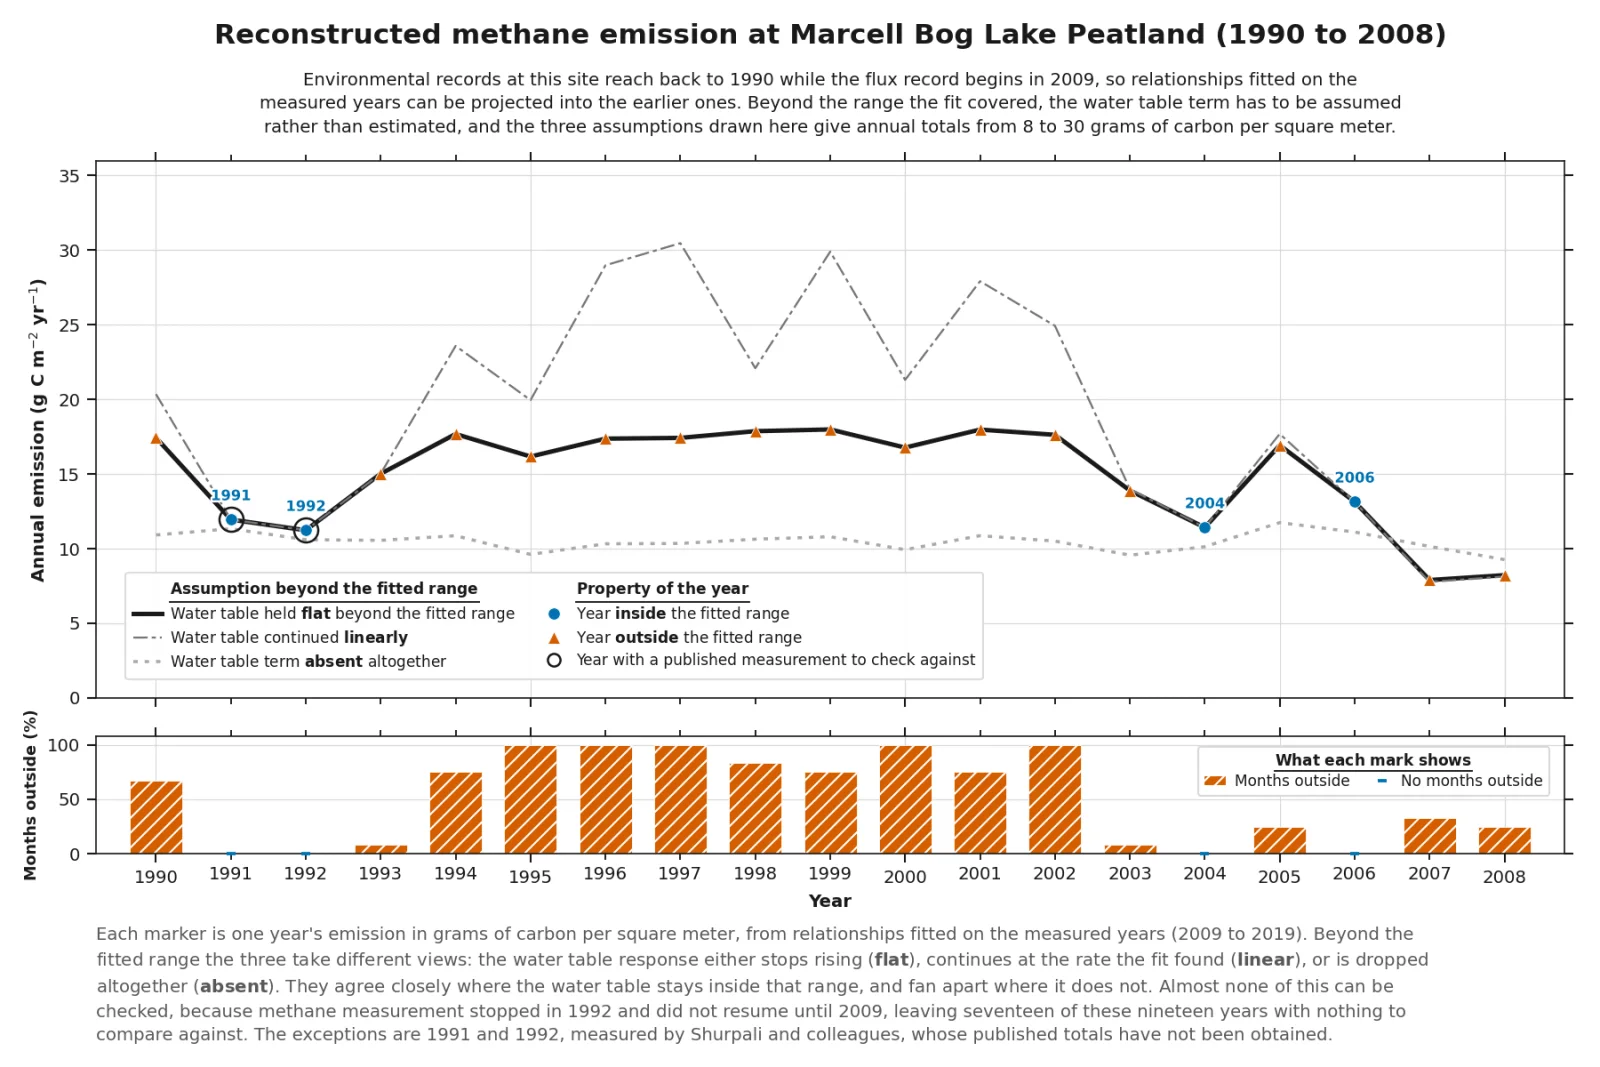
Relationships fitted on the measured years can be projected into the earlier ones, but the water table term has to be assumed beyond the range the fit covered. The model only ever saw the water table across a 0.33 meter band; projecting back to 1990 asks for 0.29 meters above it. Refitting on progressively drier months shows the coefficient climbing at every step, which means it describes the months it was fitted on rather than the peatland. The three assumptions drawn give annual totals from 8 to 30 grams of carbon per square meter, and almost none of it can be checked, because methane measurement stopped in 1992 and did not resume until 2009.
Diagnostic
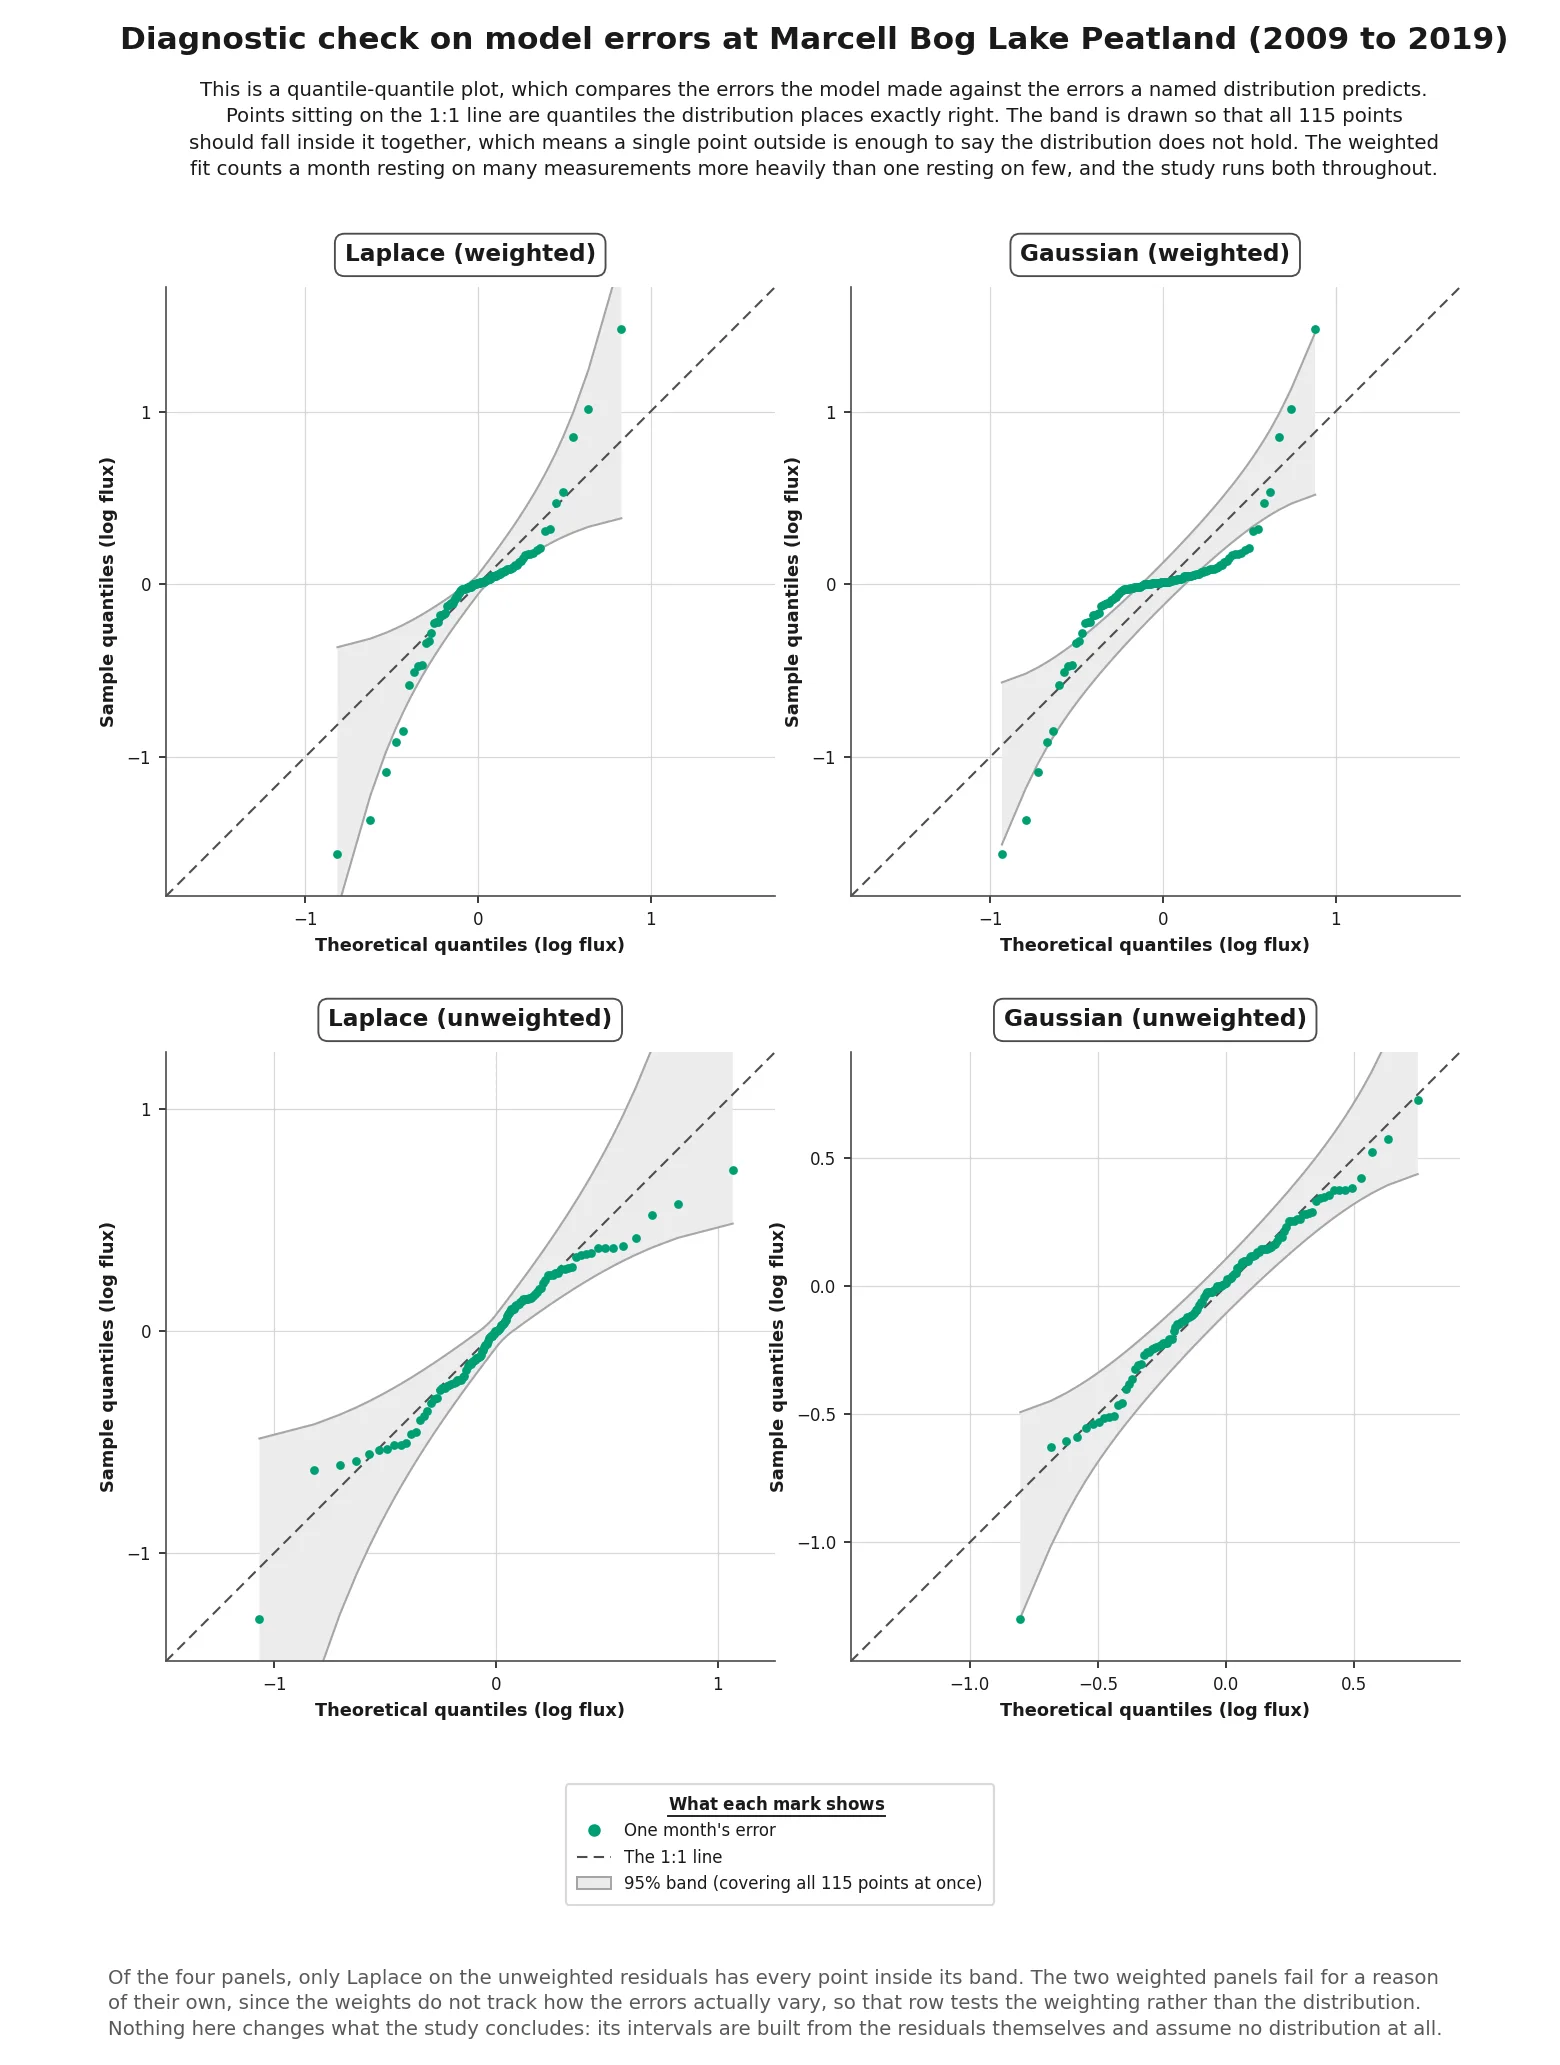
Of the four checks, two distributions on weighted and unweighted residuals, only Laplace on the unweighted residuals holds. Nothing here changes what the study concludes: its intervals are built from the residuals themselves and assume no distribution at all.
Reproduction
The 2022 study built an ensemble of LightGBM, SARIMAX, Prophet, and XGBoost over ordinary least squares; soil temperature was the strongest signal, with a Pearson r of 0.87 with methane flux, and the ordinary least squares regression yielded an R² of 0.78. It was rebuilt from source in 2026 as a monthly study of the full 2009 to 2024 record. The rebuilt finding is narrower and more useful, and it is the one on this page.
Appendix
- Code
- matt-duyst/Peatland-Flux-Forecasting, with the working notes that record each decision.
- Data
- The tower's published record at AmeriFlux US-MBP, Marcell Bog Lake Peatland: the BASE product and the FLUXNET 2009 to 2024 release.
- Acknowledgments
- The Griffis lab at the University of Minnesota, where the 2022 work was done, and the USDA Forest Service, which runs the Marcell Experimental Forest and the tower.