I engineered the team's shared covariate extraction tooling, a Python client that queries five authoritative geospatial sources through one interface and consolidates what were previously fragmented workflows into a single maintained codebase. I benchmark biomass and structural vegetation architectures spanning deep learning, ensemble methods, and process-based ecological models, with outputs supporting quantification under the Regenerative Standard, VM0042, and CAR-SEP, and extend them into counterfactual baselines that reconstruct expected productivity under business-as-usual management, a required step under each methodology. Ranch-level stratification is designed around SEP v2, where clustering geophysically similar ground directly reduces the sampling uncertainty that drives credit deductions. This work is under active development and unpublished; publications are forthcoming.
Matt Duyst

I'm an environmental data scientist at Grassroots Carbon, where I build the data systems and models that turn satellite imagery, soil samples, and climate records into the biomass and soil carbon estimates behind verified carbon credits.
Before that I was at SeekOps, a NASA JPL spin-off, measuring methane from drones: I led a study of flare destruction removal efficiency across the Bakken and Permian basins and published it at SPE ATCE 2024.
I hold a Master of Environmental Science from Yale in machine learning, remote sensing, and spatial statistics, fully funded as a Merit Research Scholar and Hixon Center Fellow, with a summer at the University of Minnesota's Marcell Experimental Forest forecasting methane from a peatland flux tower, and an Honorable Mention at the 2022 Global Stocktake Climate Datathon ahead of COP 27. My BA is from UCLA, in Geography and Environmental Studies with minors in GIS and English.
I grew up on a small citrus farm near Sequoia National Park, where land, climate, and livelihood were never abstract.
The route so far.
A map you drive. Press play to travel the route in time order, or pick a stop. Zoom, pan, and read as you go; nothing here waits on the page scroll.
Projects.
One question runs through all of it: how well can what happens on the land be measured from above? The work moves across scales, from satellite estimates of carbon on about three million acres of rangeland and methane over a river delta of 150 million people, through drone surveys of gas flares and solar arrays, to a single tower in a Minnesota peatland measured half-hour by half-hour. Each project carries its figures and code where they can be shown. The oldest are the maps that taught the craft.
-
Grassland growth across US rangeland for soil carbon verification20252025 to presentStatus publications forthcomingFigures forthcoming.
-
Urban expansion, paddy rice, and atmospheric methane over the Yangtze River Delta2023MESc thesis, 2023Reproduction Reproduced 2026, with errata
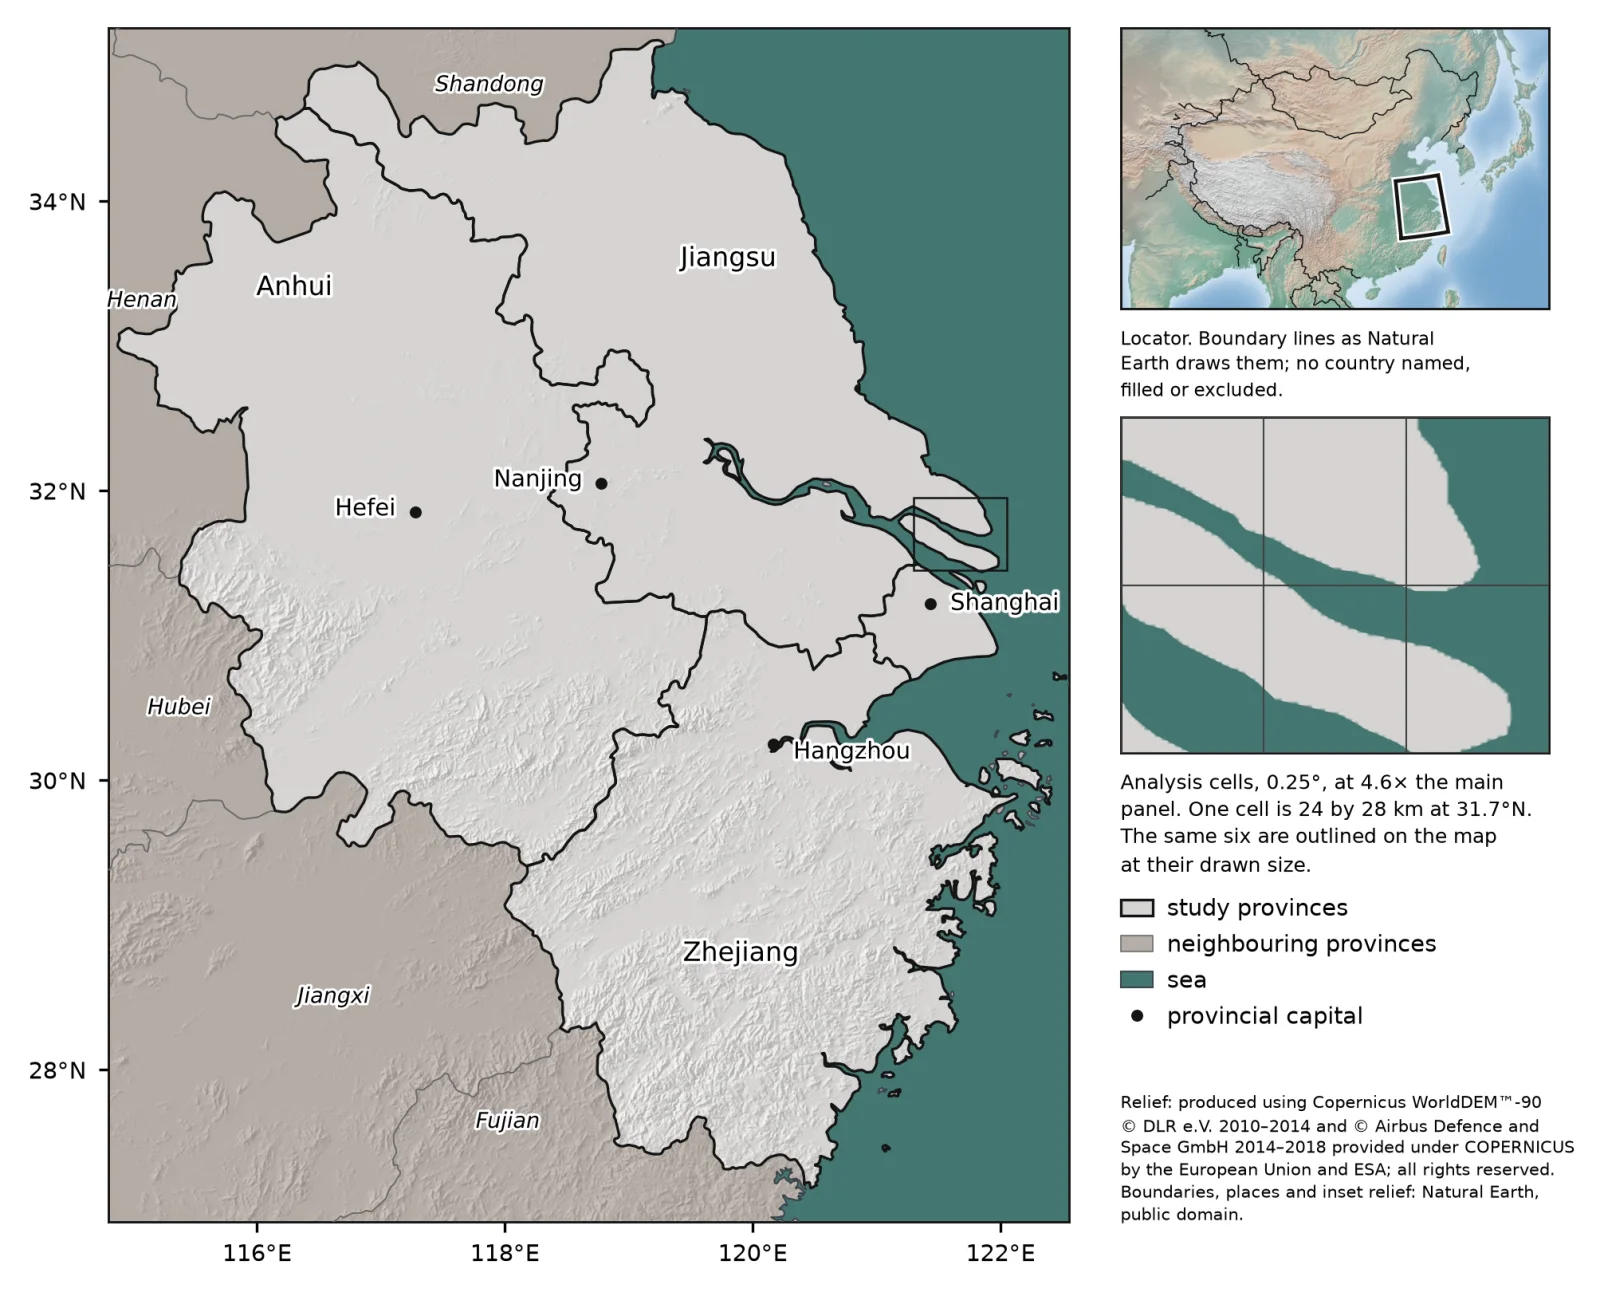
The four provinces on relief, with the 0.25 degree analysis cells. 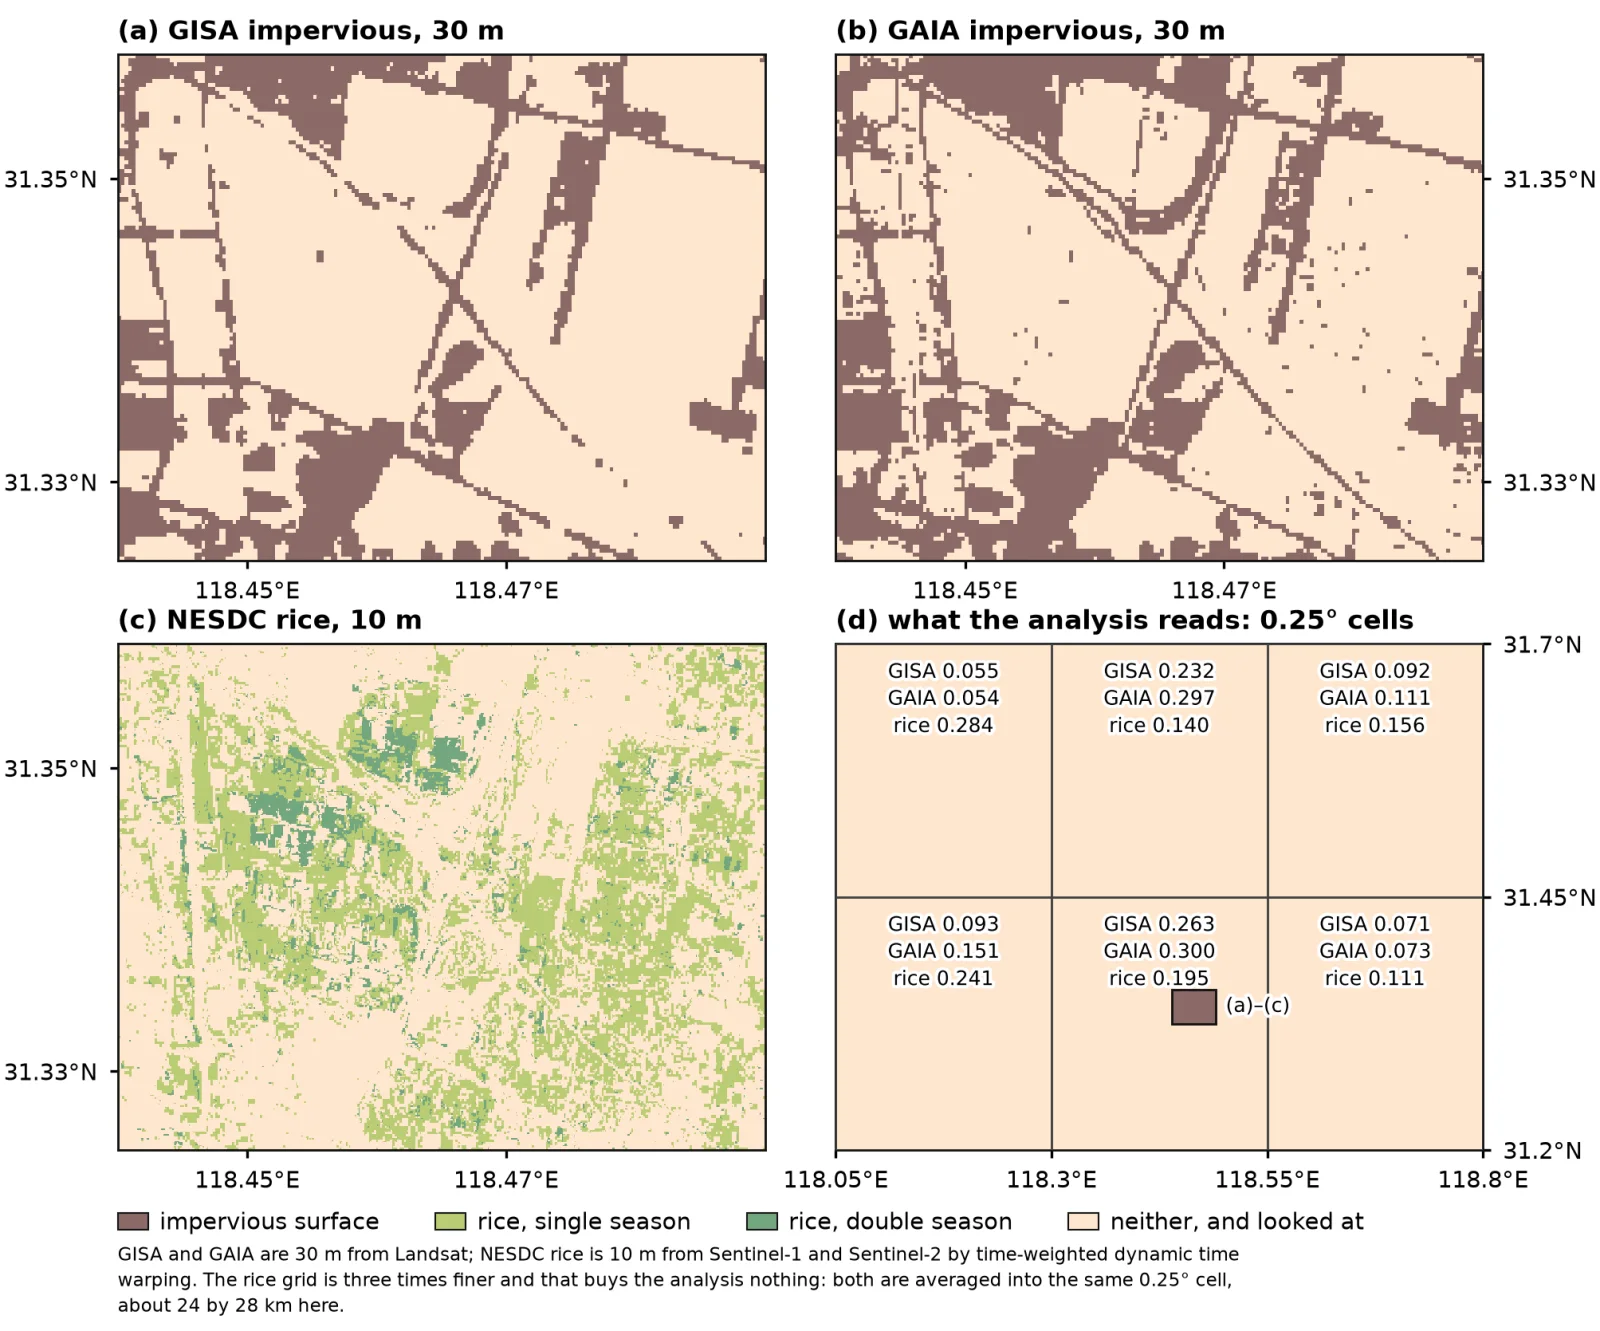
What the analysis reads: 30 m impervious, 10 m rice, and the cell they share. 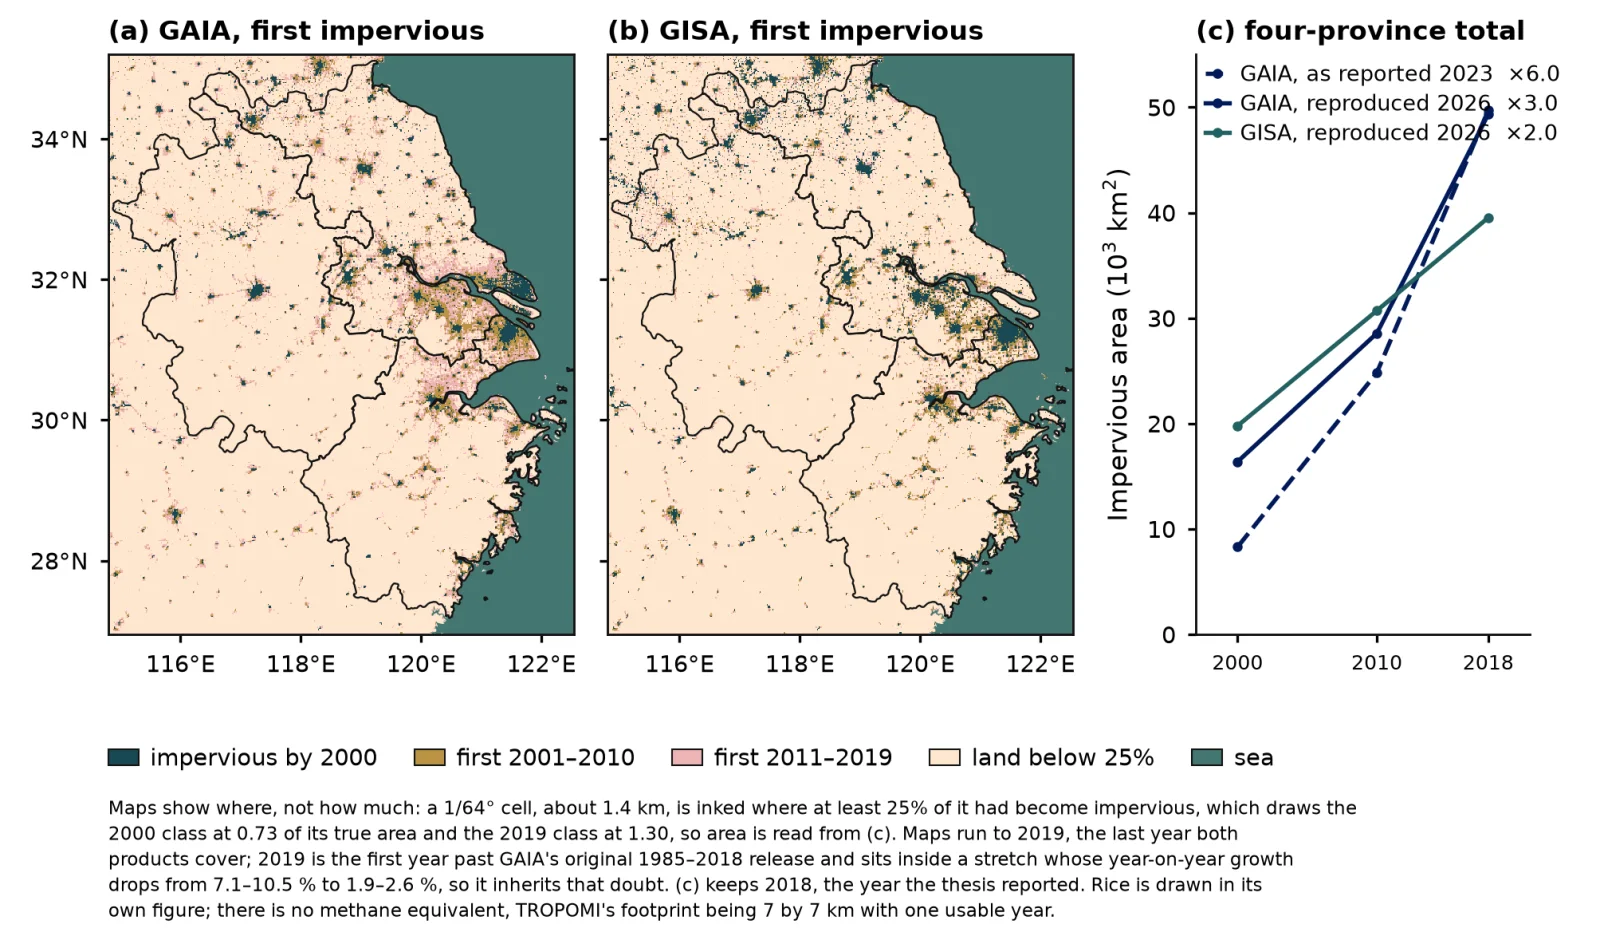
Where the delta became impervious, and how much, 2000 to 2019.
-
Forecasting and reconstructing monthly methane flux at Marcell Bog Lake Peatland2022Visiting Research Scientist, 2022Reproduction Rebuilt 2026
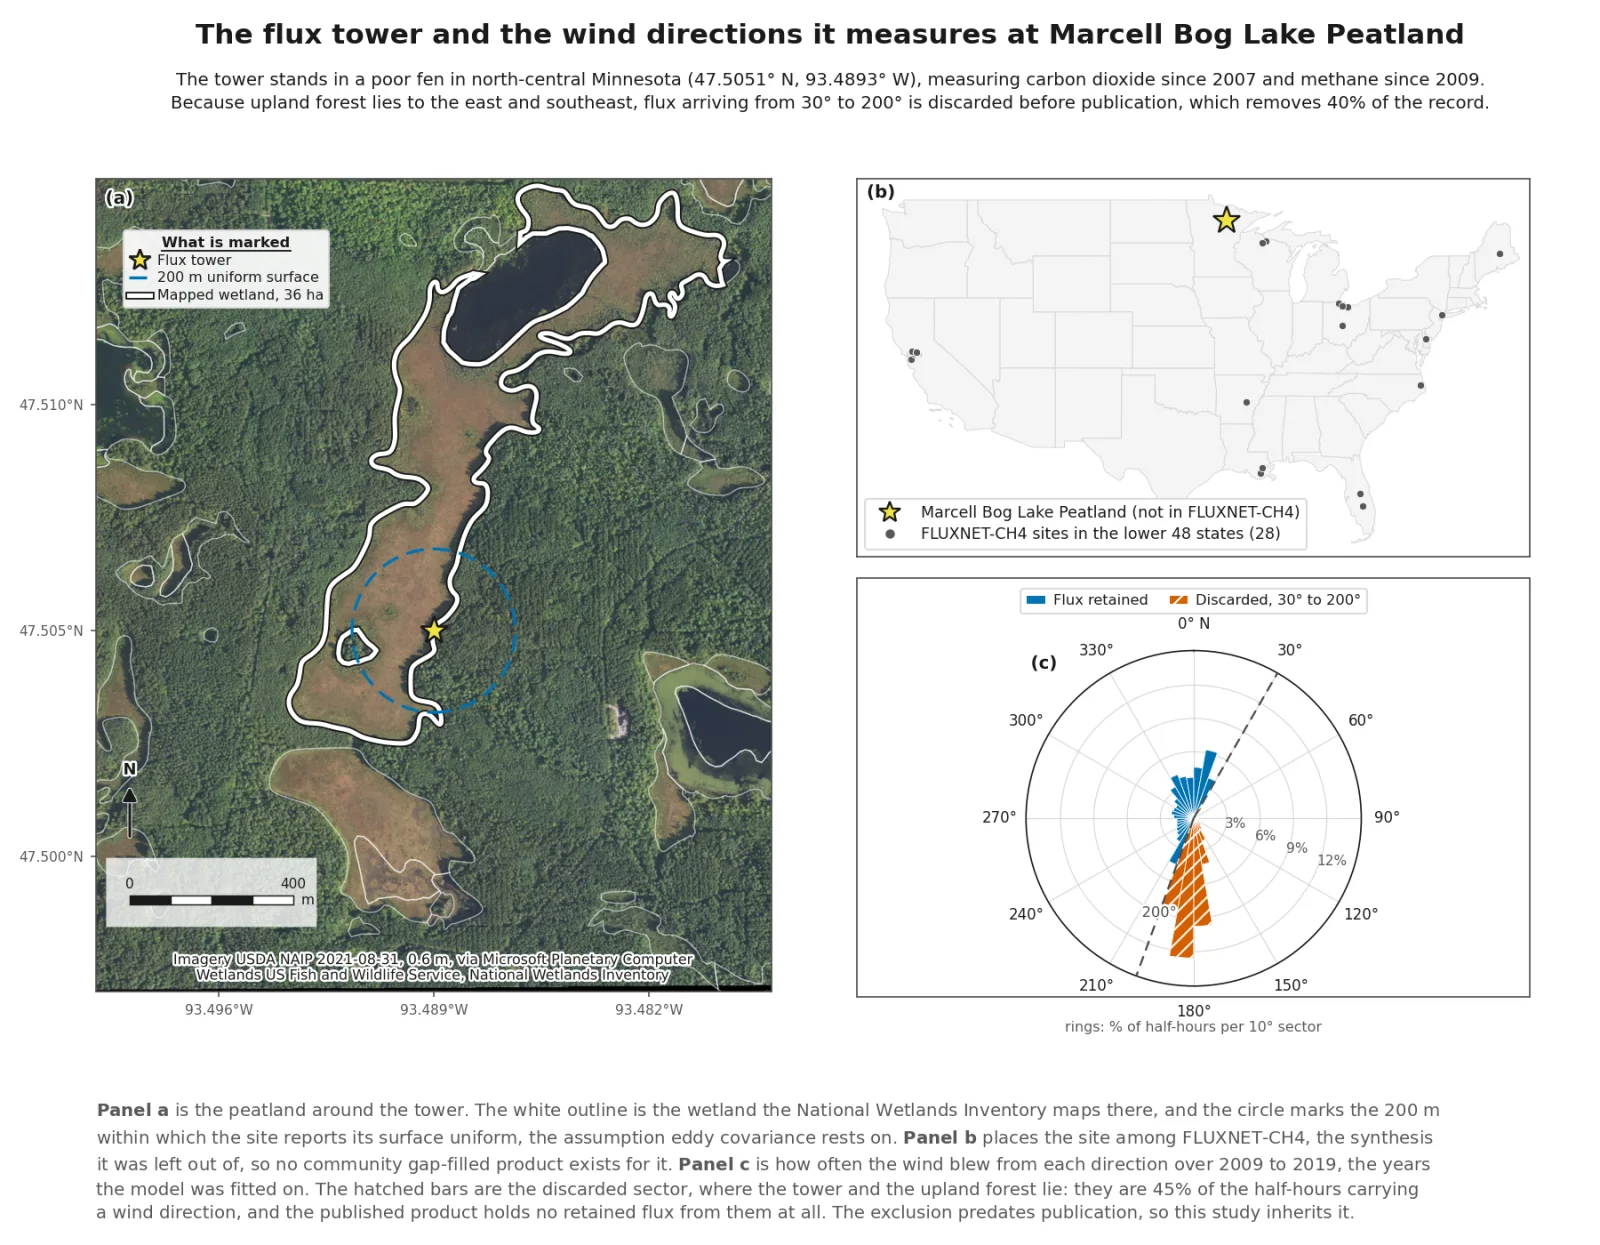
The flux tower, its wetland, and the wind sectors it keeps. 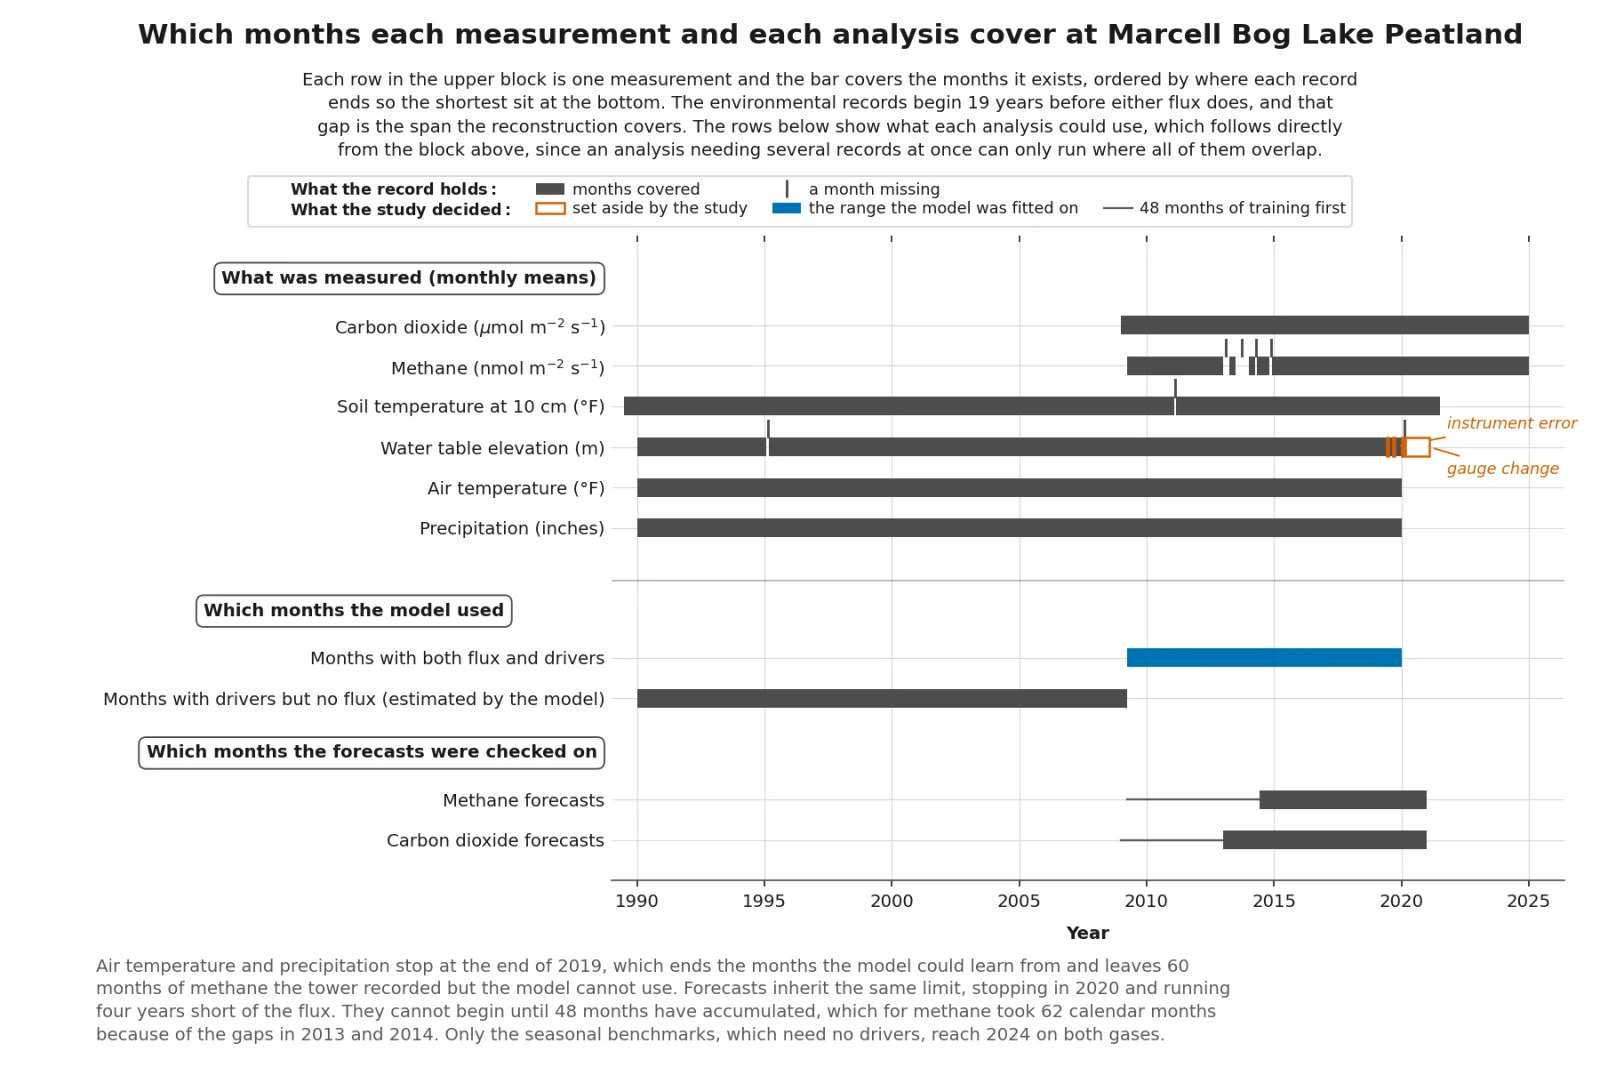
Which months each record covers, and where the model could run. 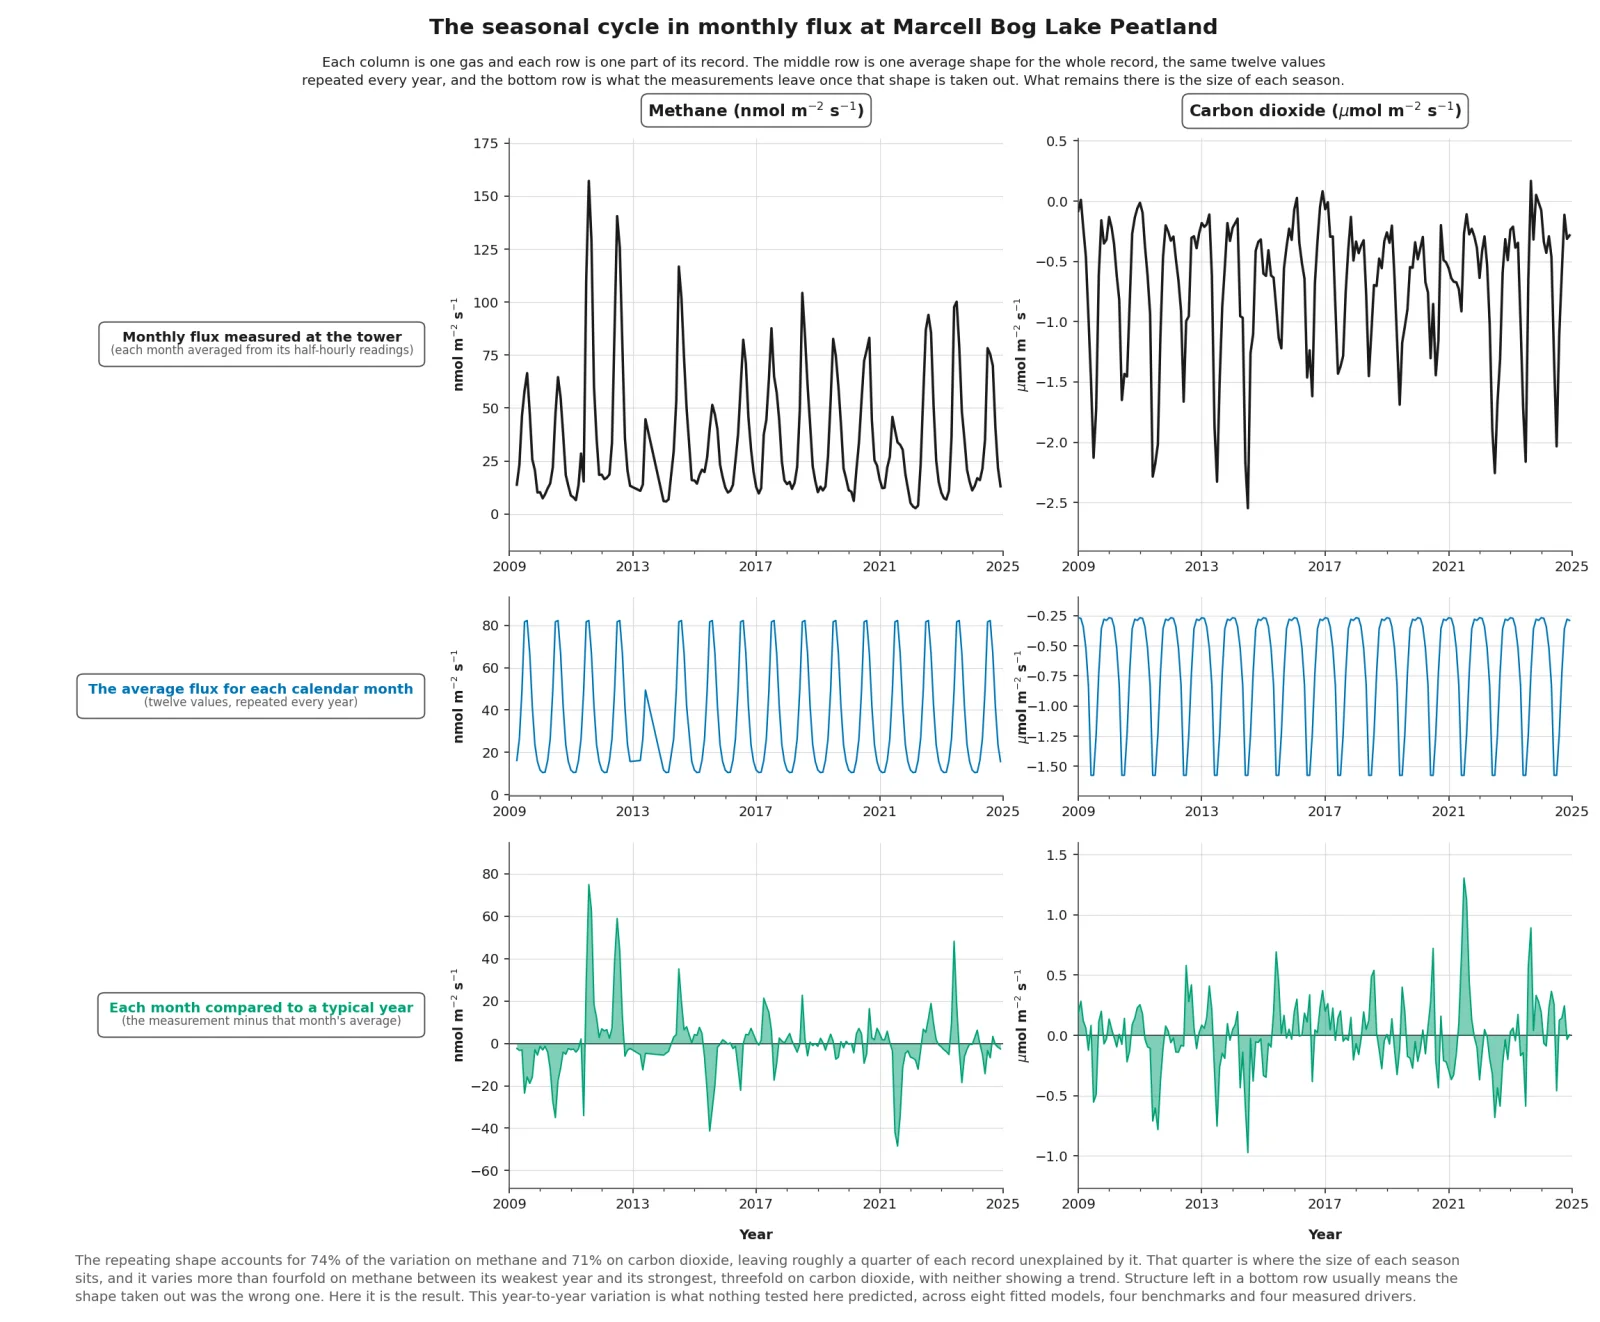
The seasonal shape of the record, and what each year leaves over. 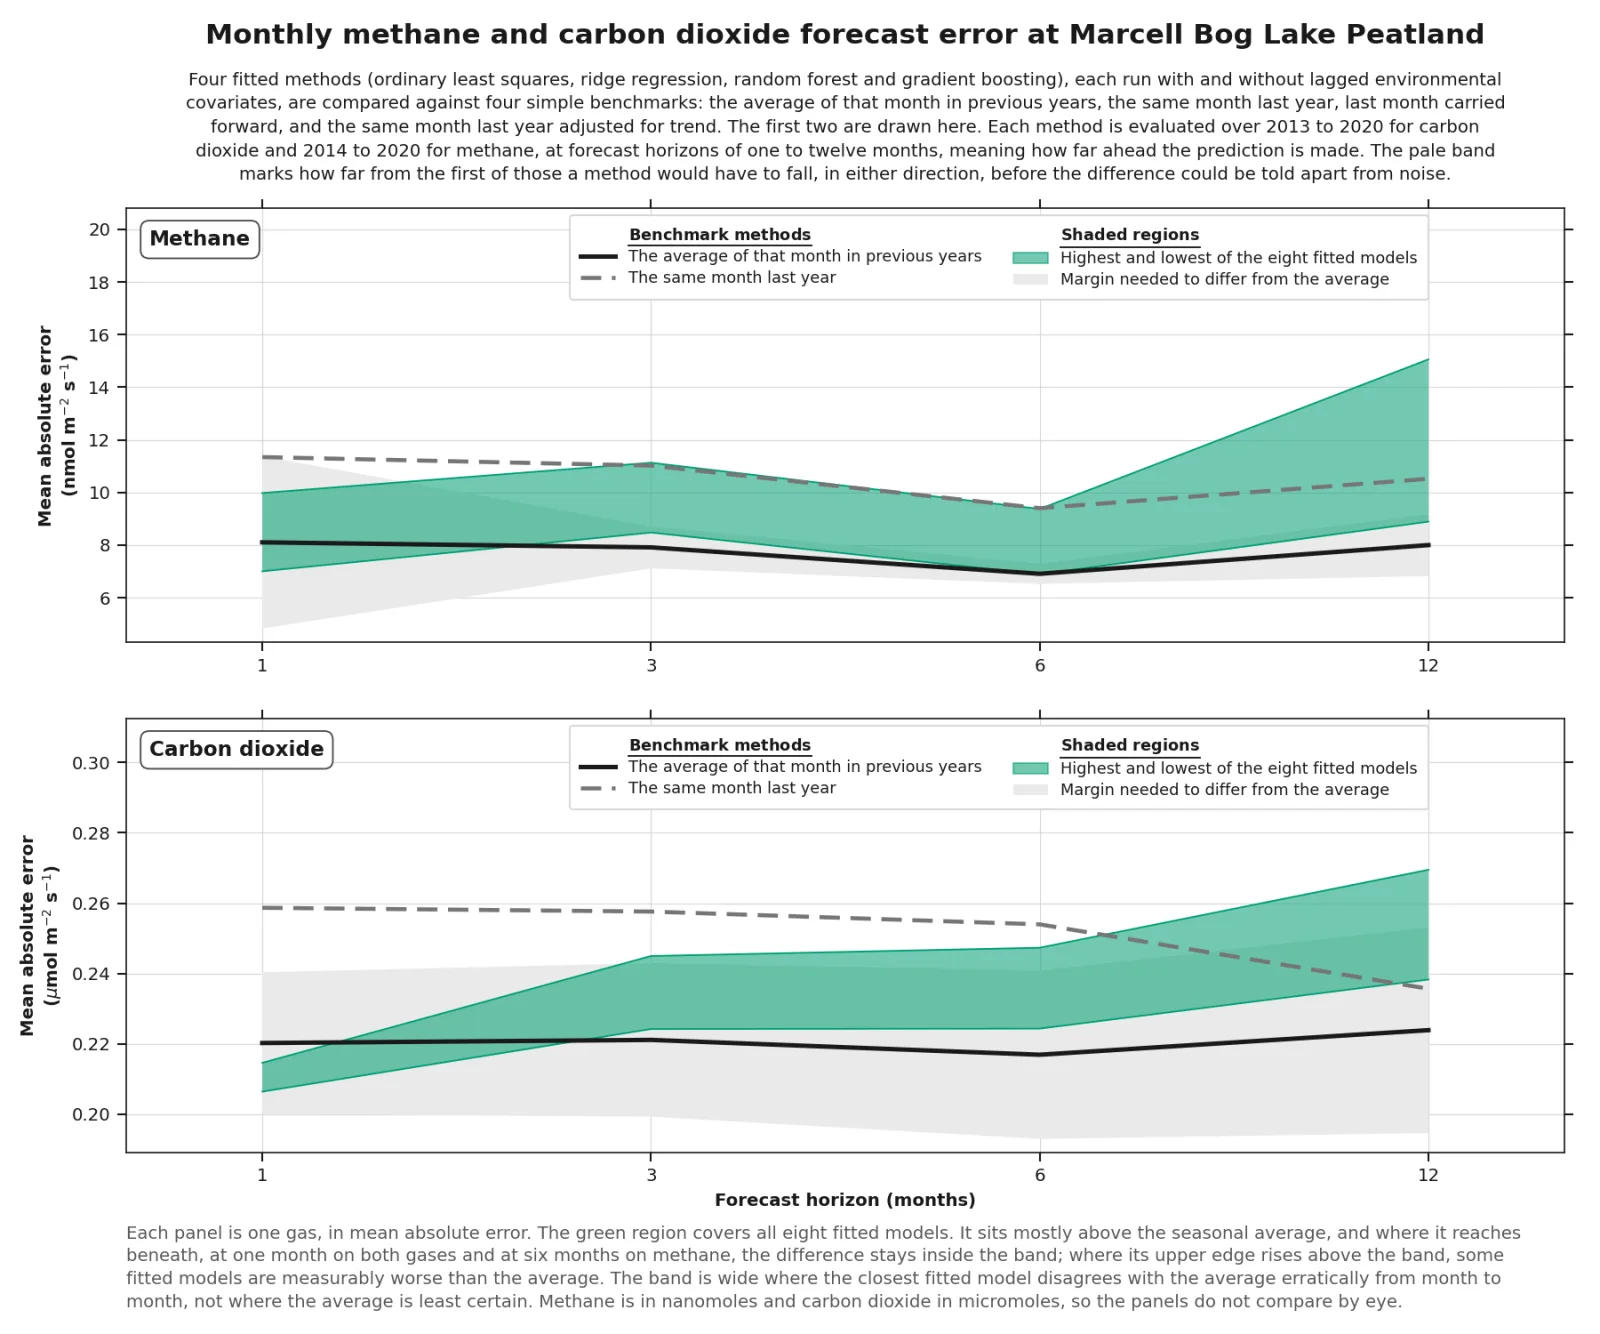
Fitted models rarely beat the seasonal average at any horizon. 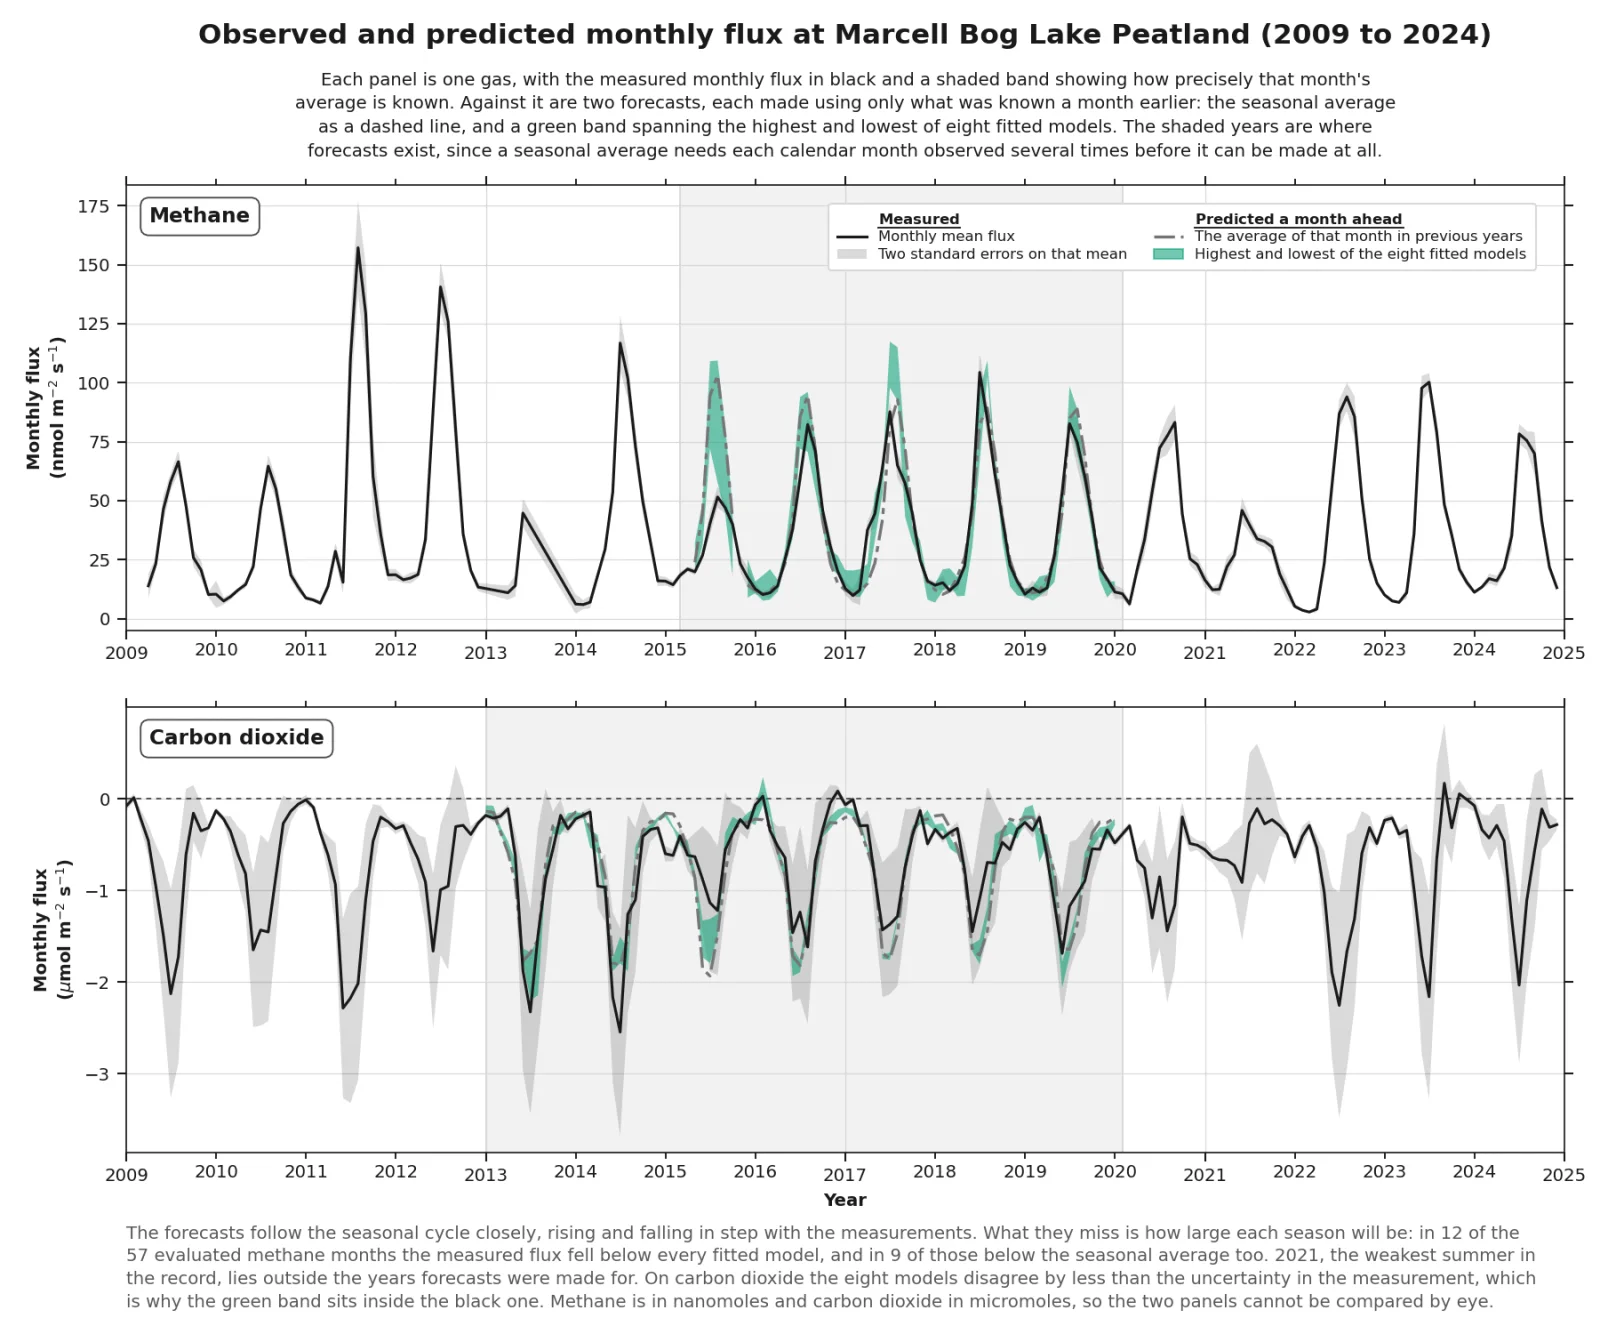
Forecasts follow the seasonal cycle; the size of each season escapes them. 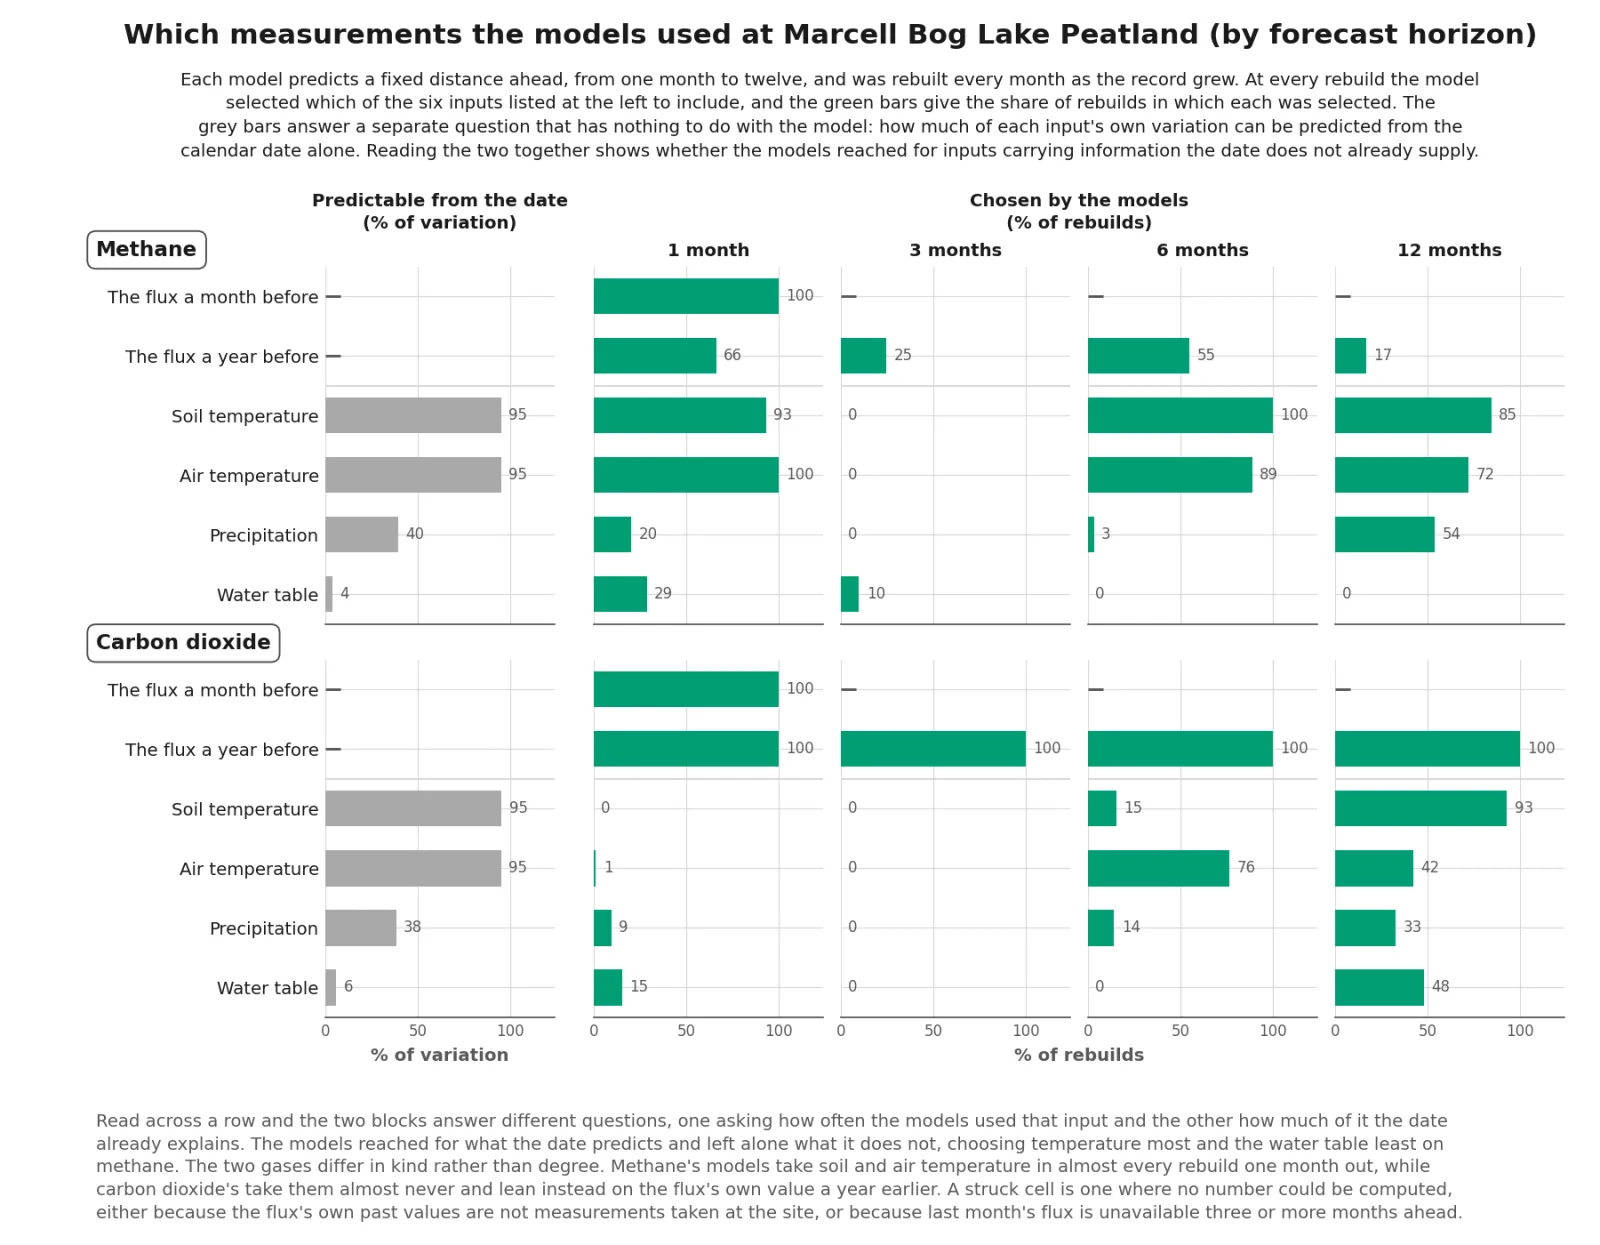
Which inputs the models chose, against what the date already explains. 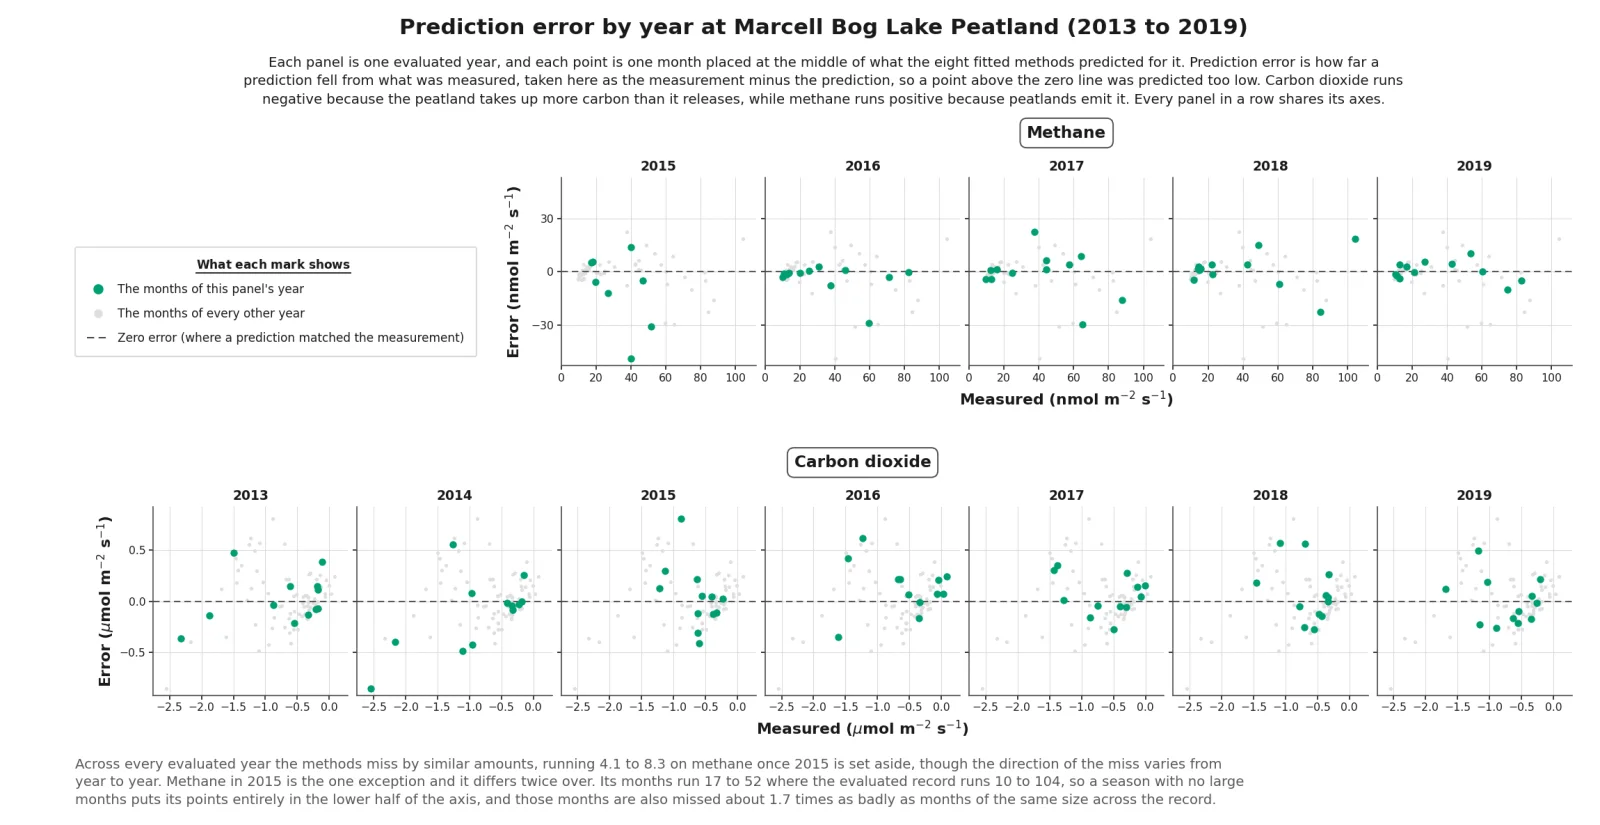
Prediction error by year: similar misses, in varying directions. 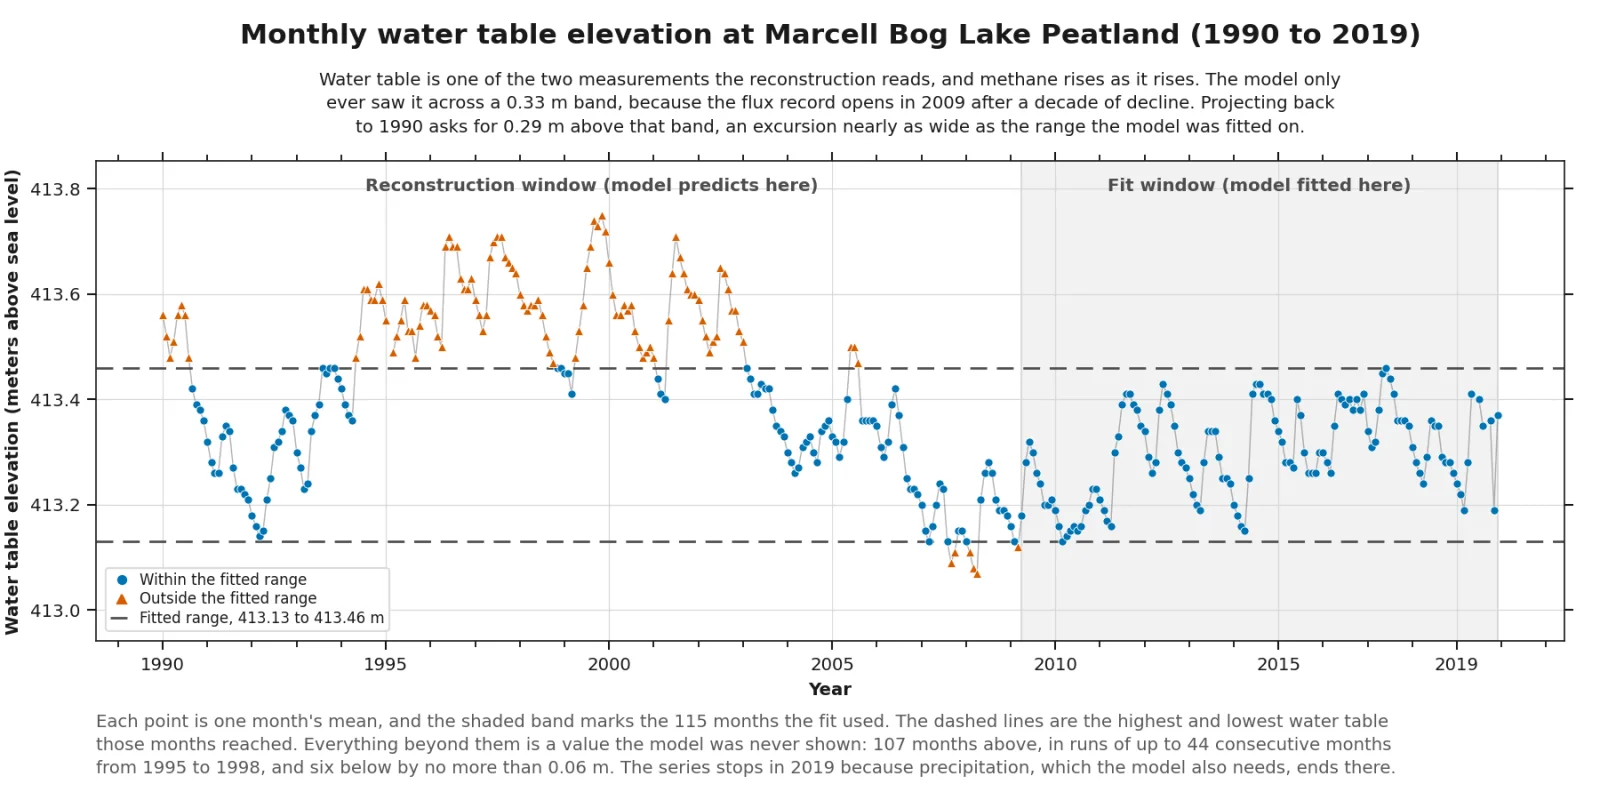
Water table beyond the fitted range, where the backcast must assume. 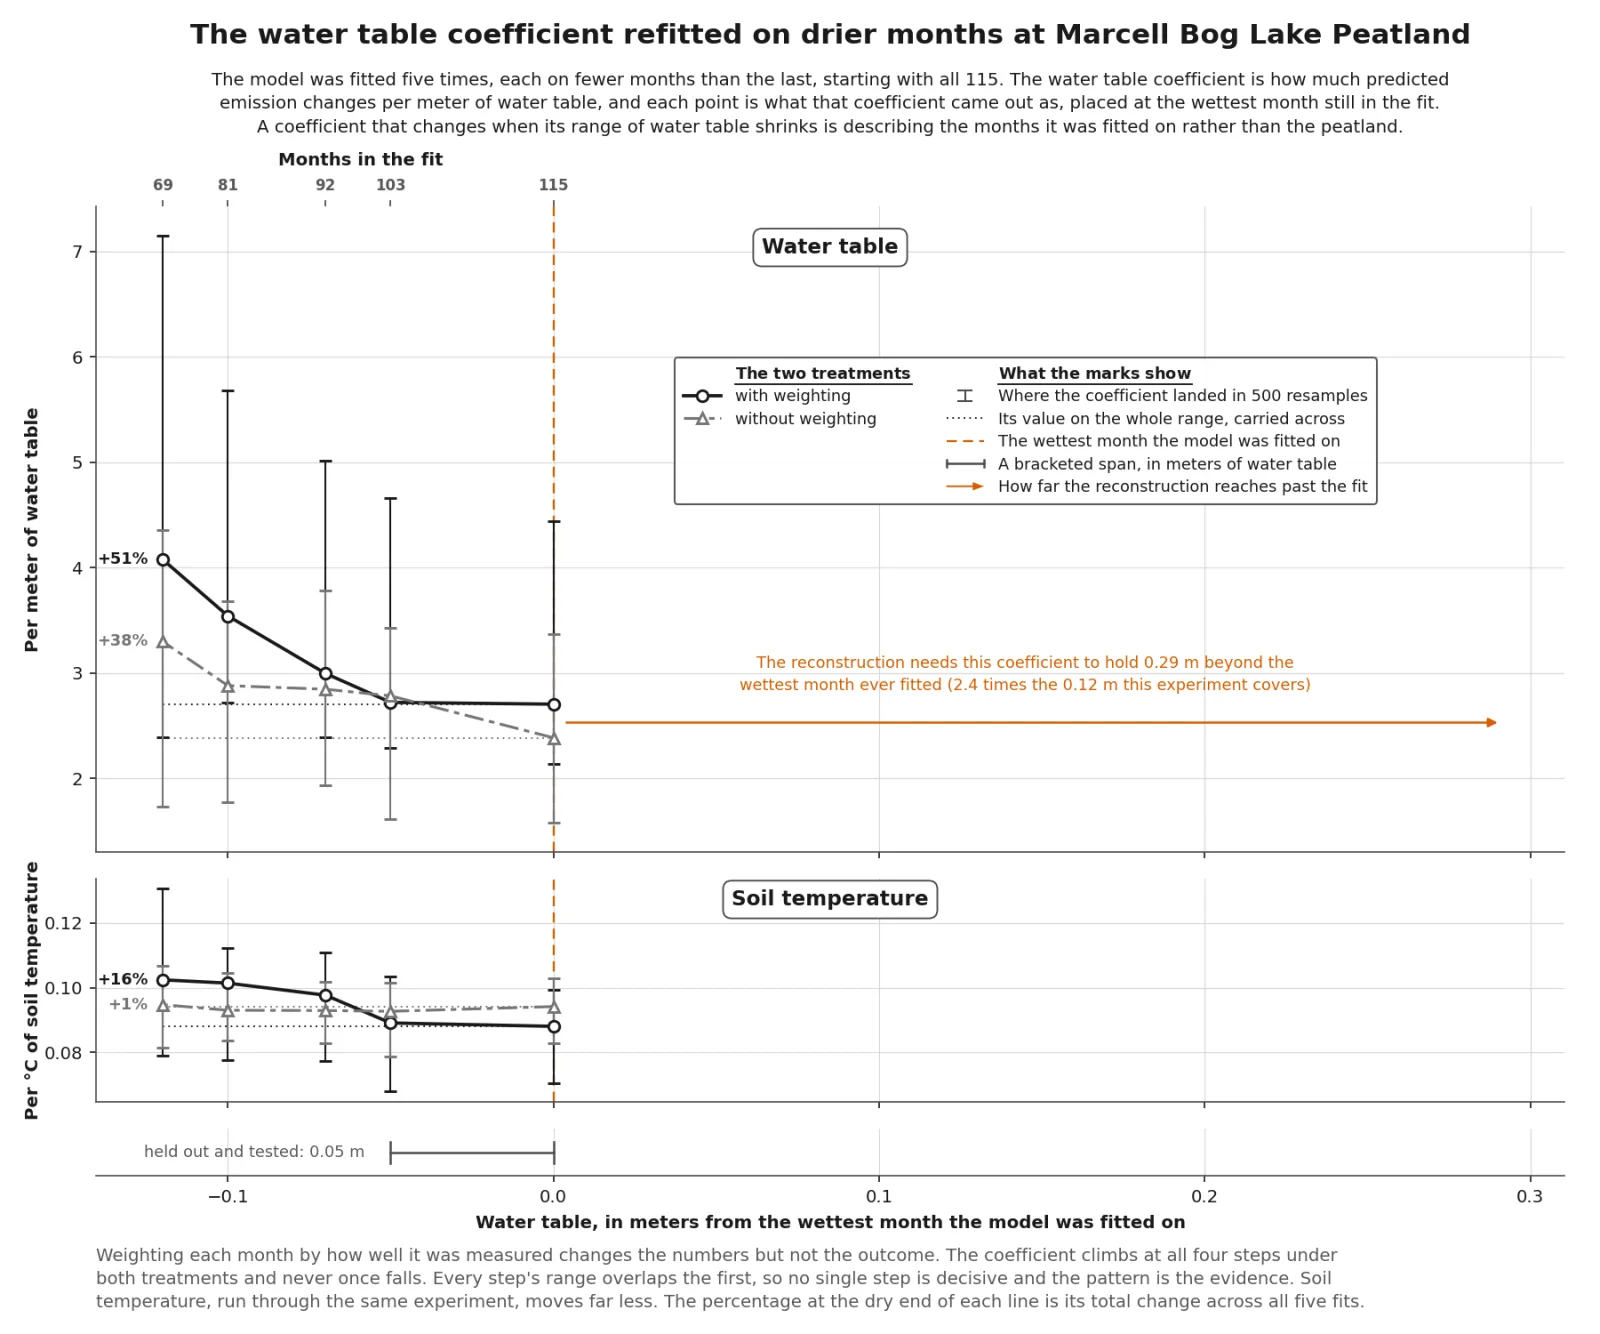
The water table coefficient climbs as the fit is restricted to drier months. 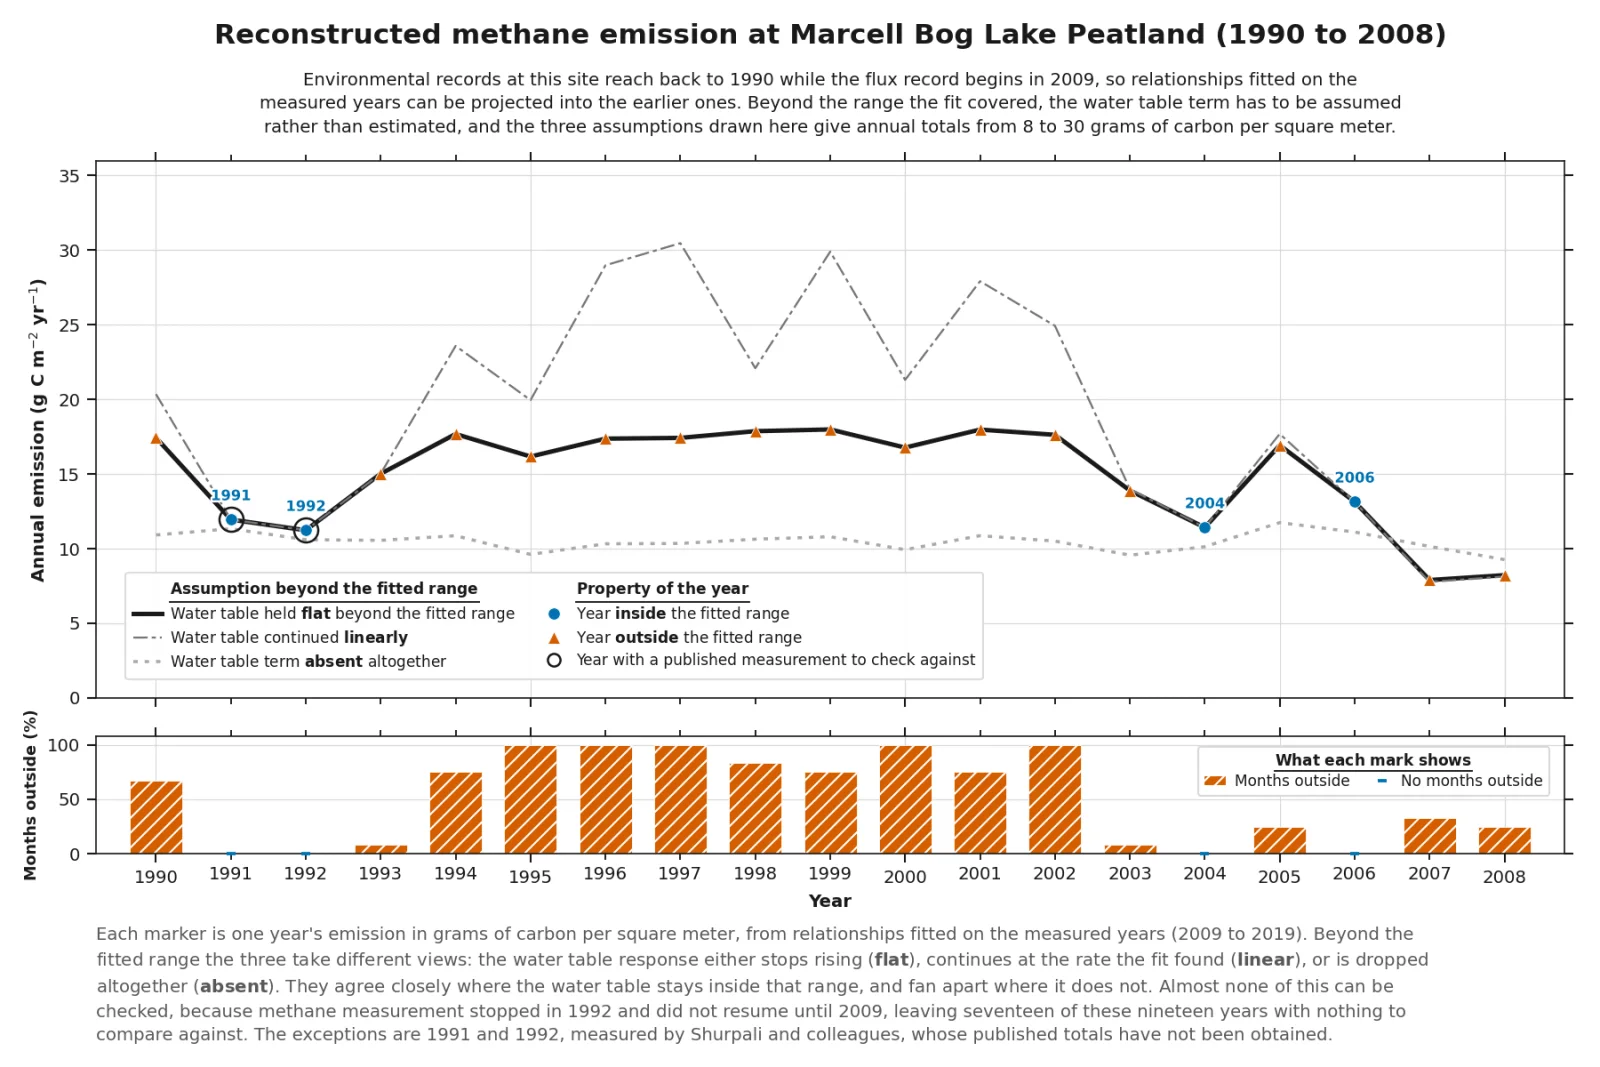
Reconstructed emission, 1990 to 2008, under three assumptions. 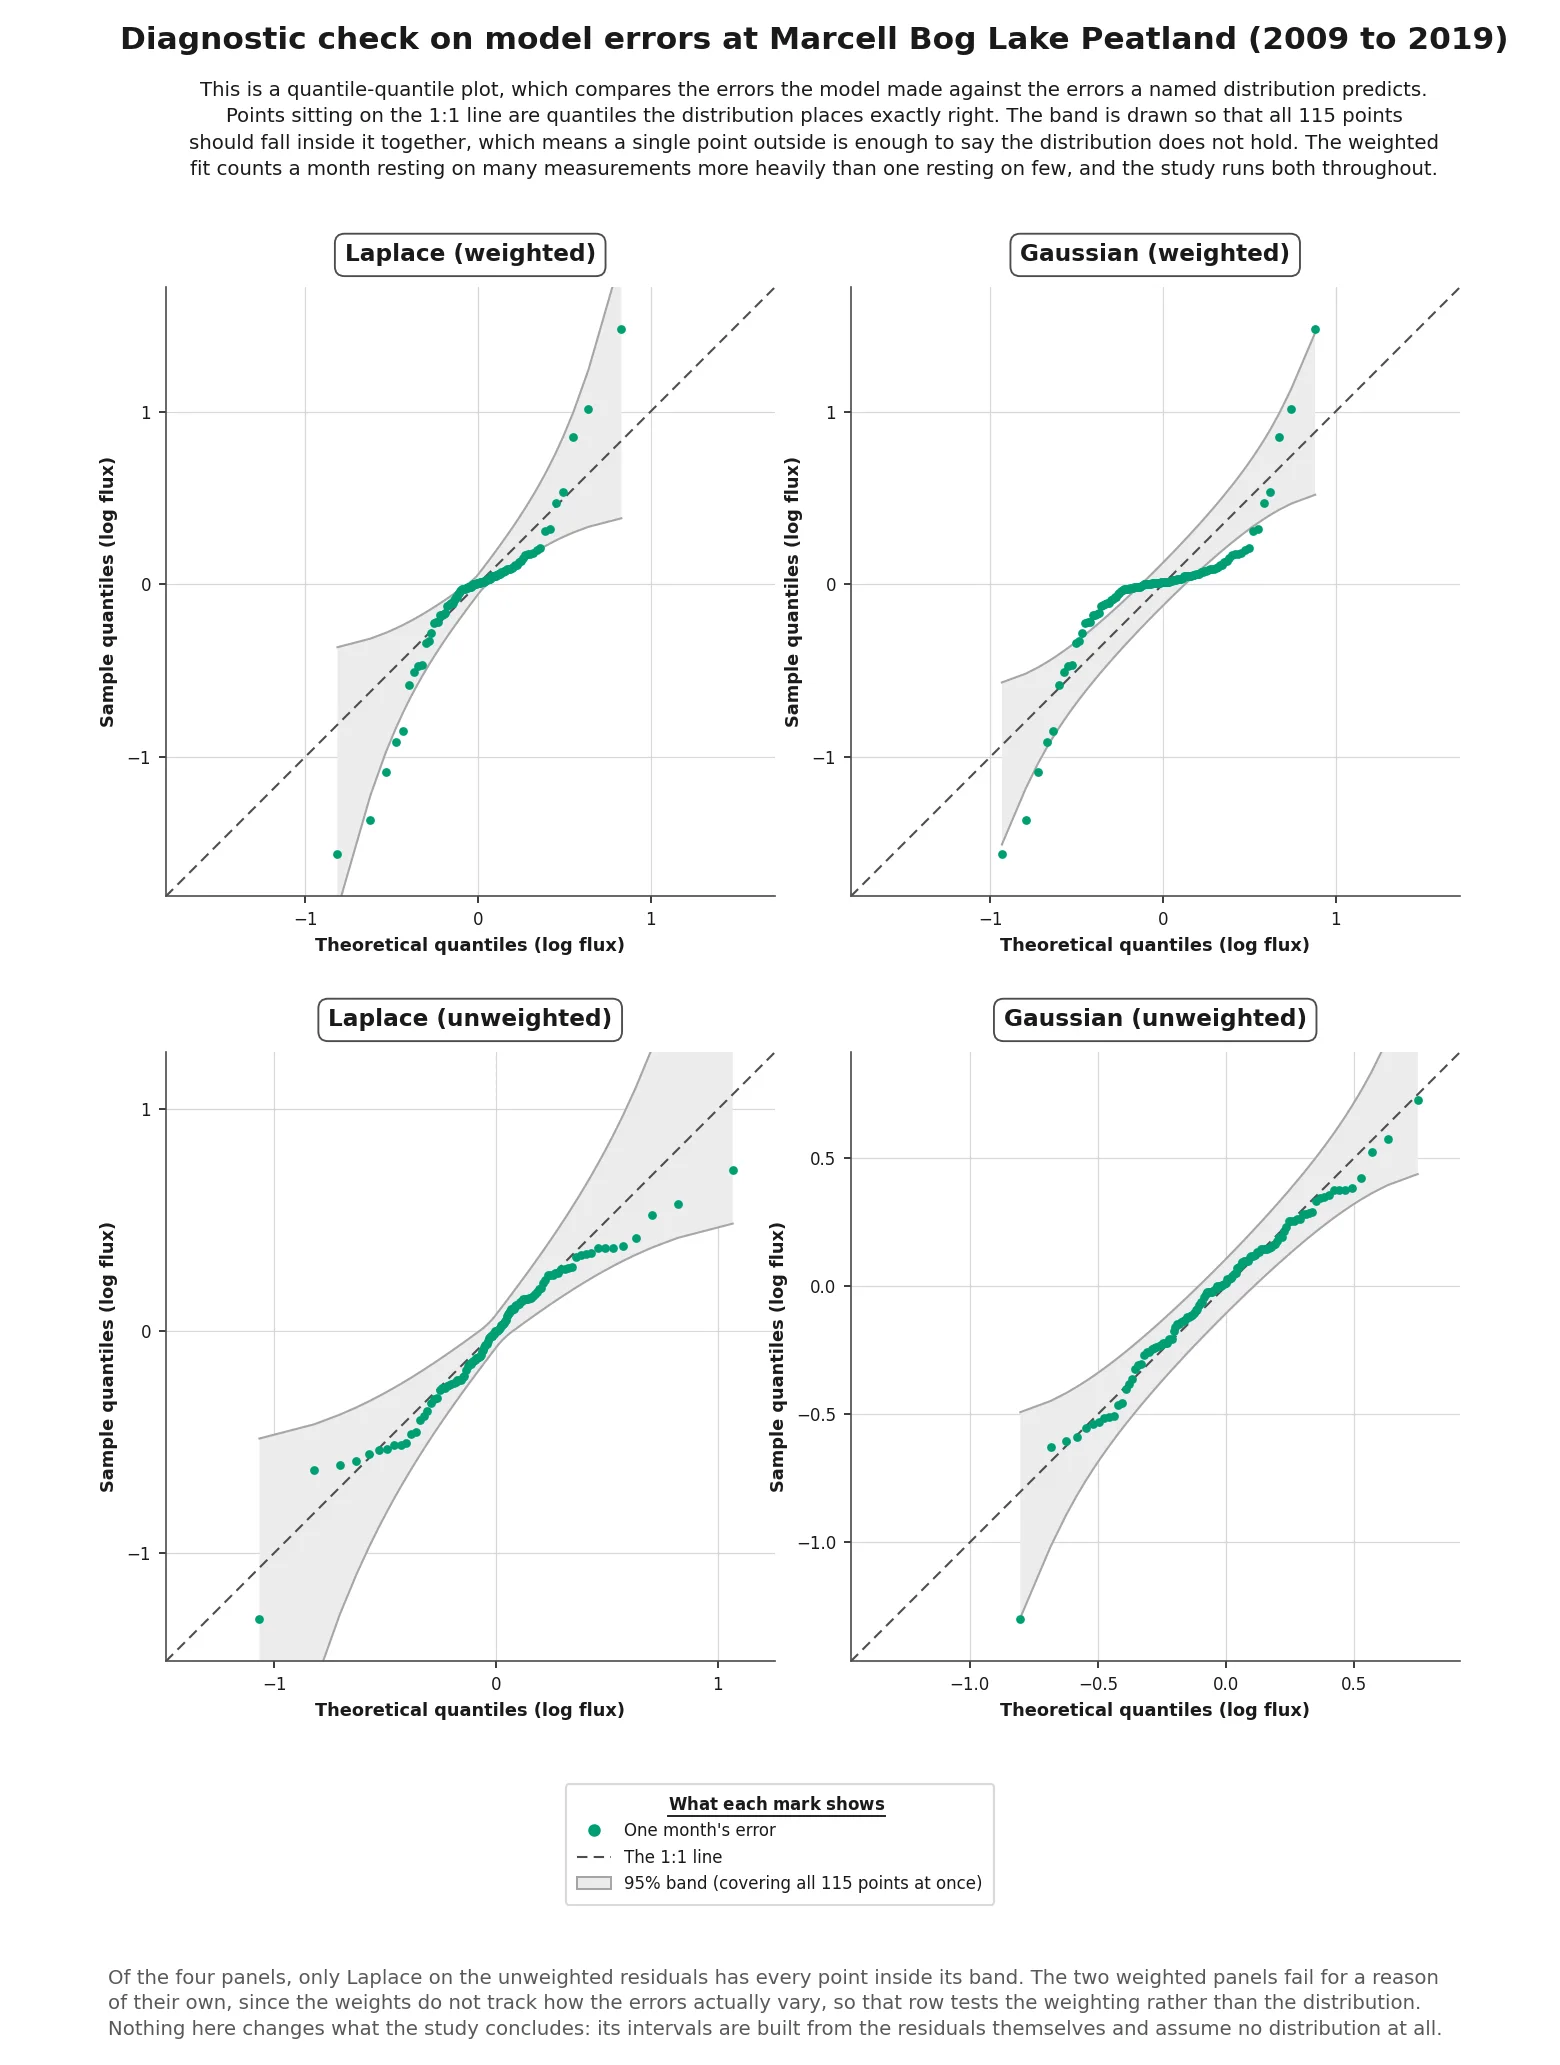
The model's errors against two distributions, weighted and unweighted.
-
Carbon trading: a cross-sectoral analysis of allowance pathways under the EU ETS20222022, ahead of COP 27Result Honorable Mention
-
Toward UAV decision-support tools for photovoltaic arrays: a coastal Connecticut thermal mosaicking case study2021Course researchStatus Report published
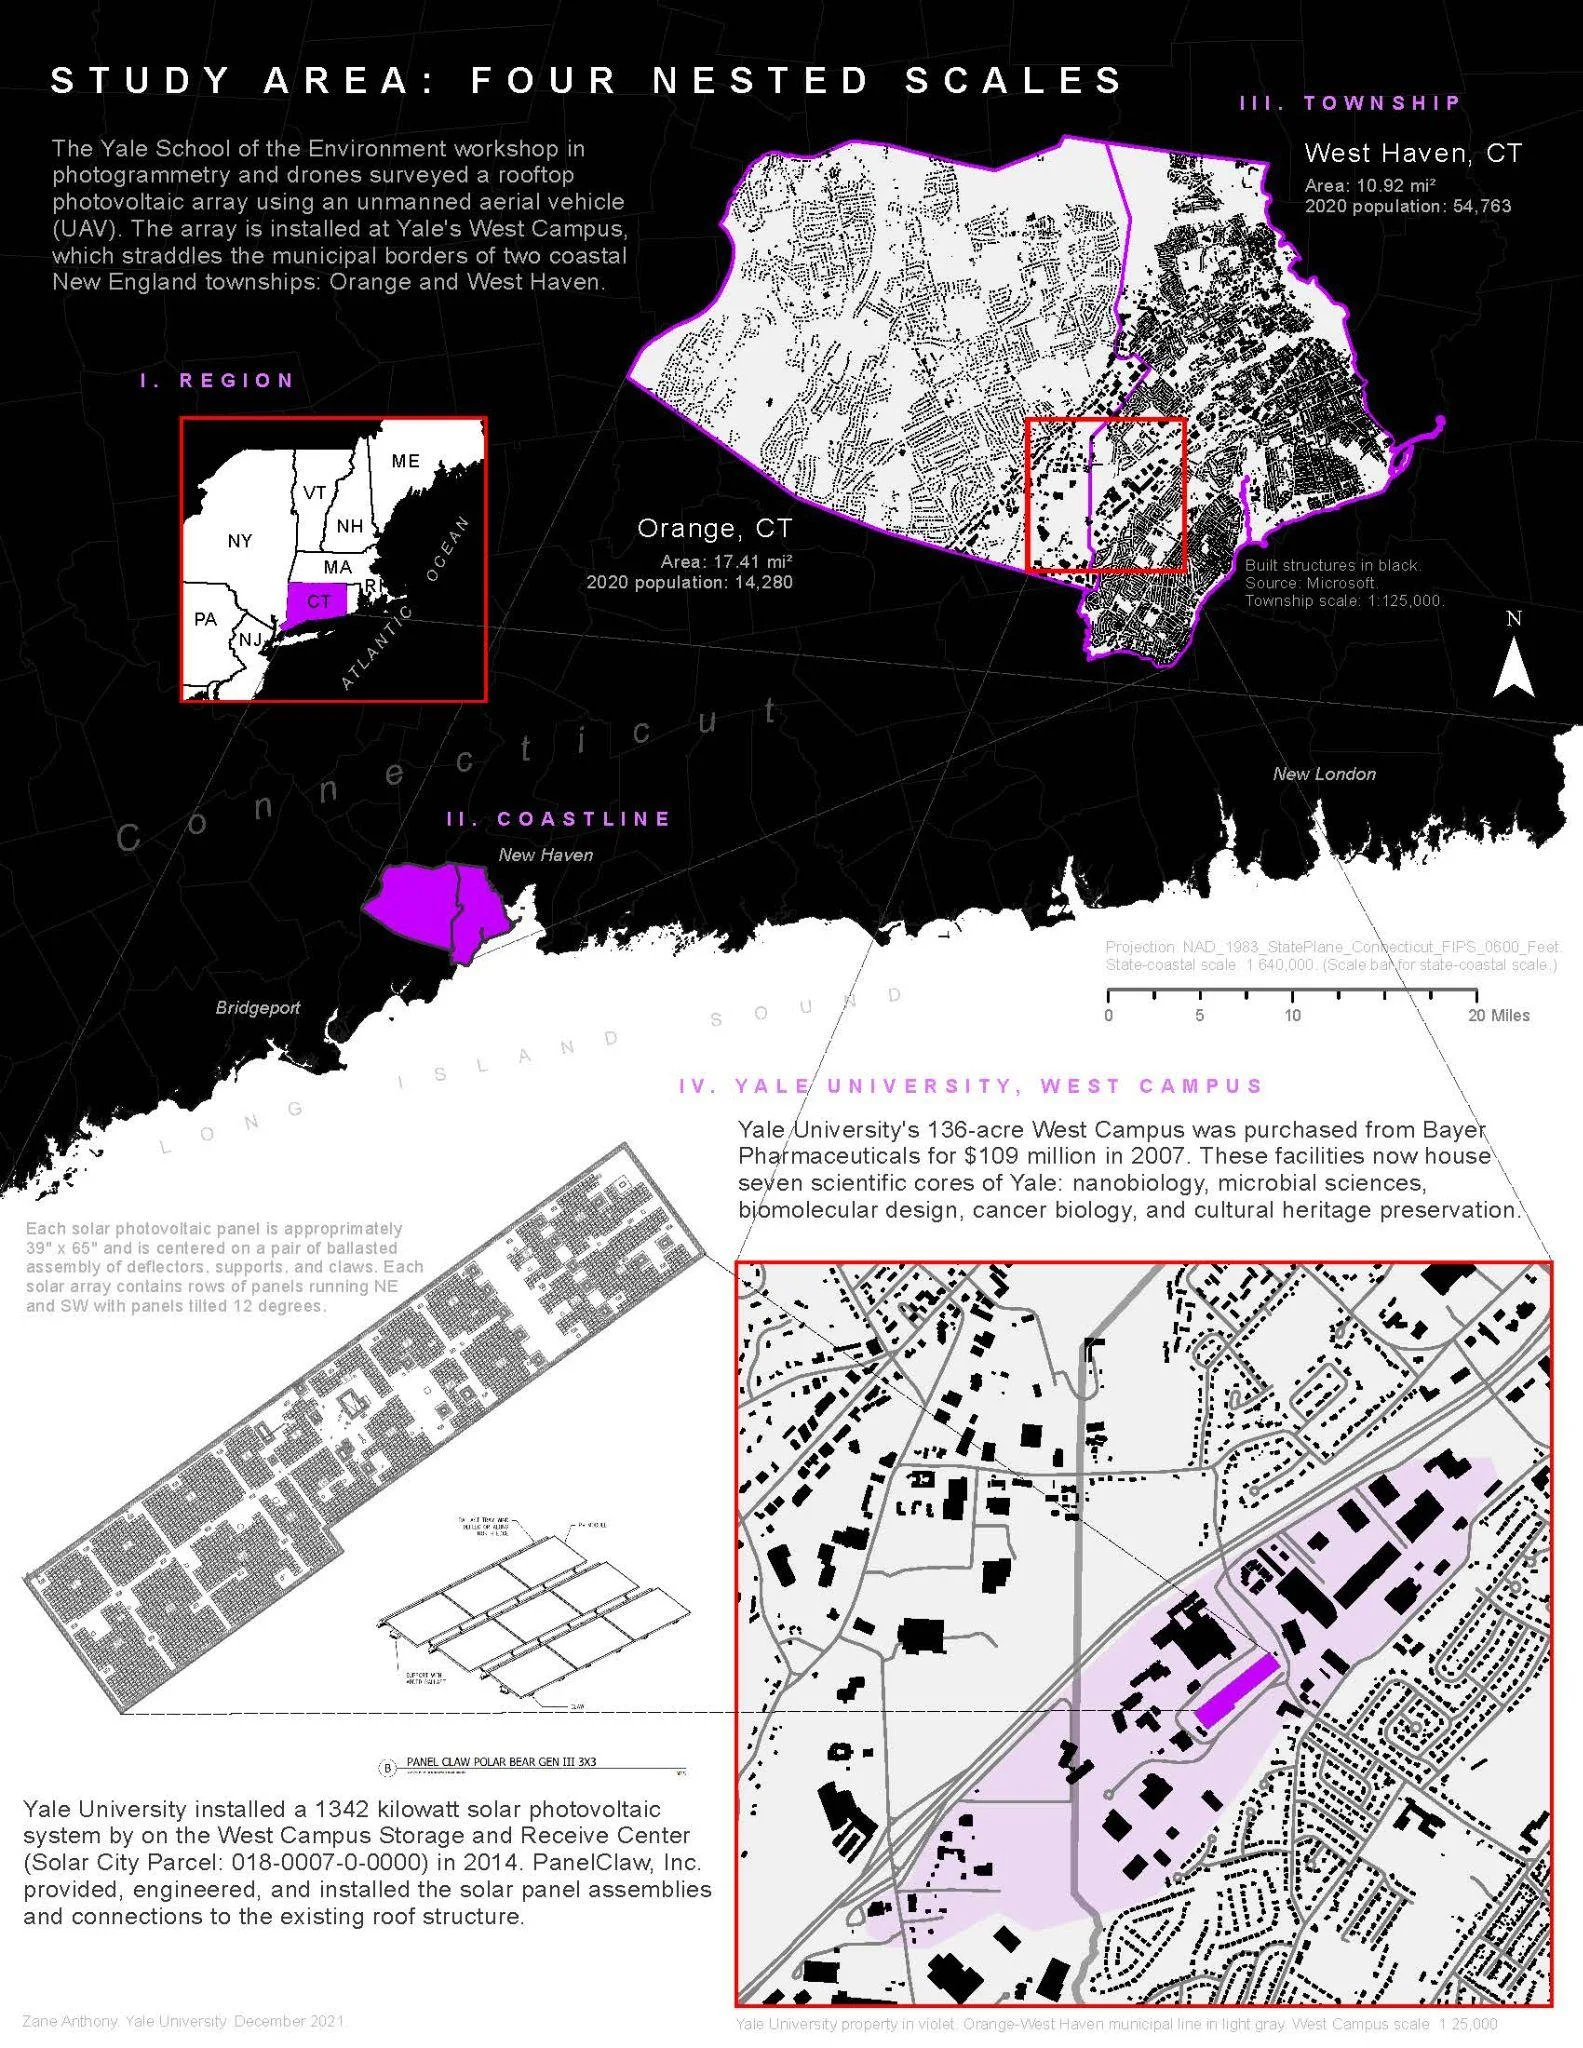
This diagram depicts the study area and PV solar arrays within four scales. 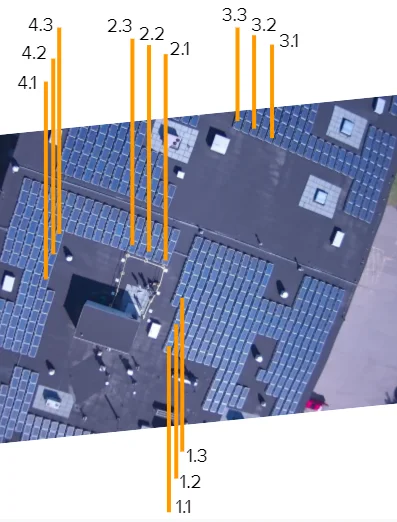
Temperature and GPS measurements were taken at these 12 solar panels. 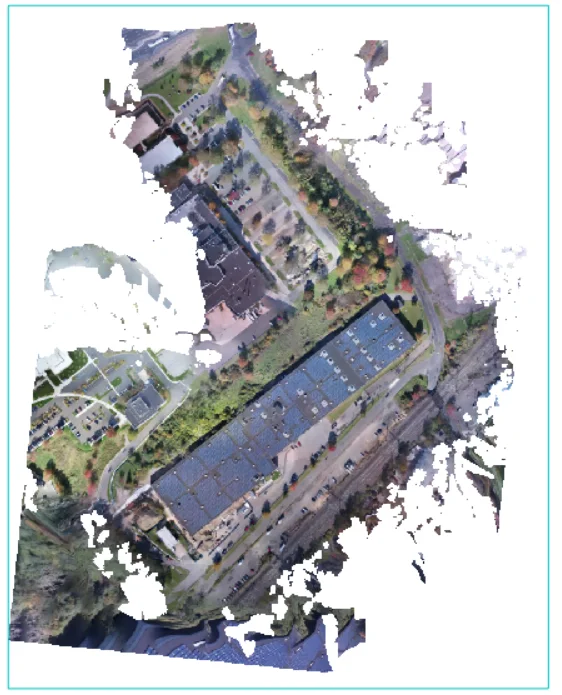
Agisoft Metashape was used to generate this RGB orthomosaic. 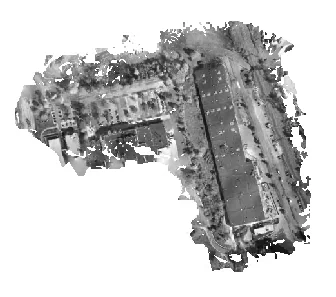
Agisoft Metashape was used to generate this thermal orthomosaic. 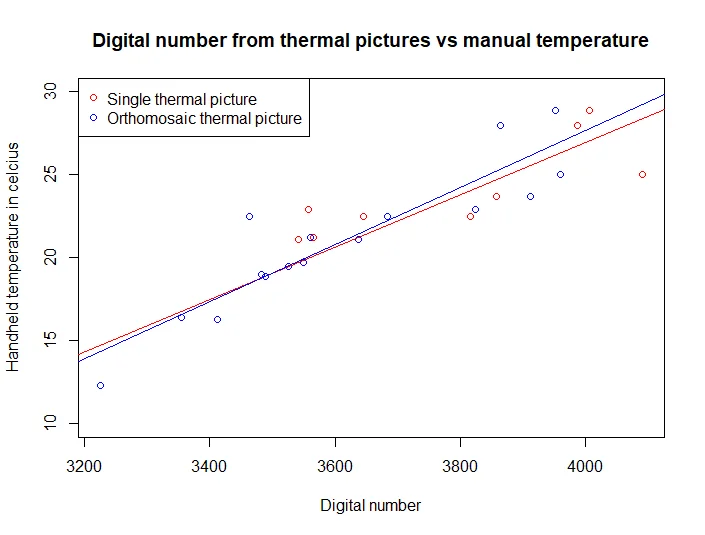
The linear regression model was consistent within the same data acquisition and processing techniques.
-
Thirty coursework projects and the undergraduate thesis2014 to 2018Archive
 Remote Sensing
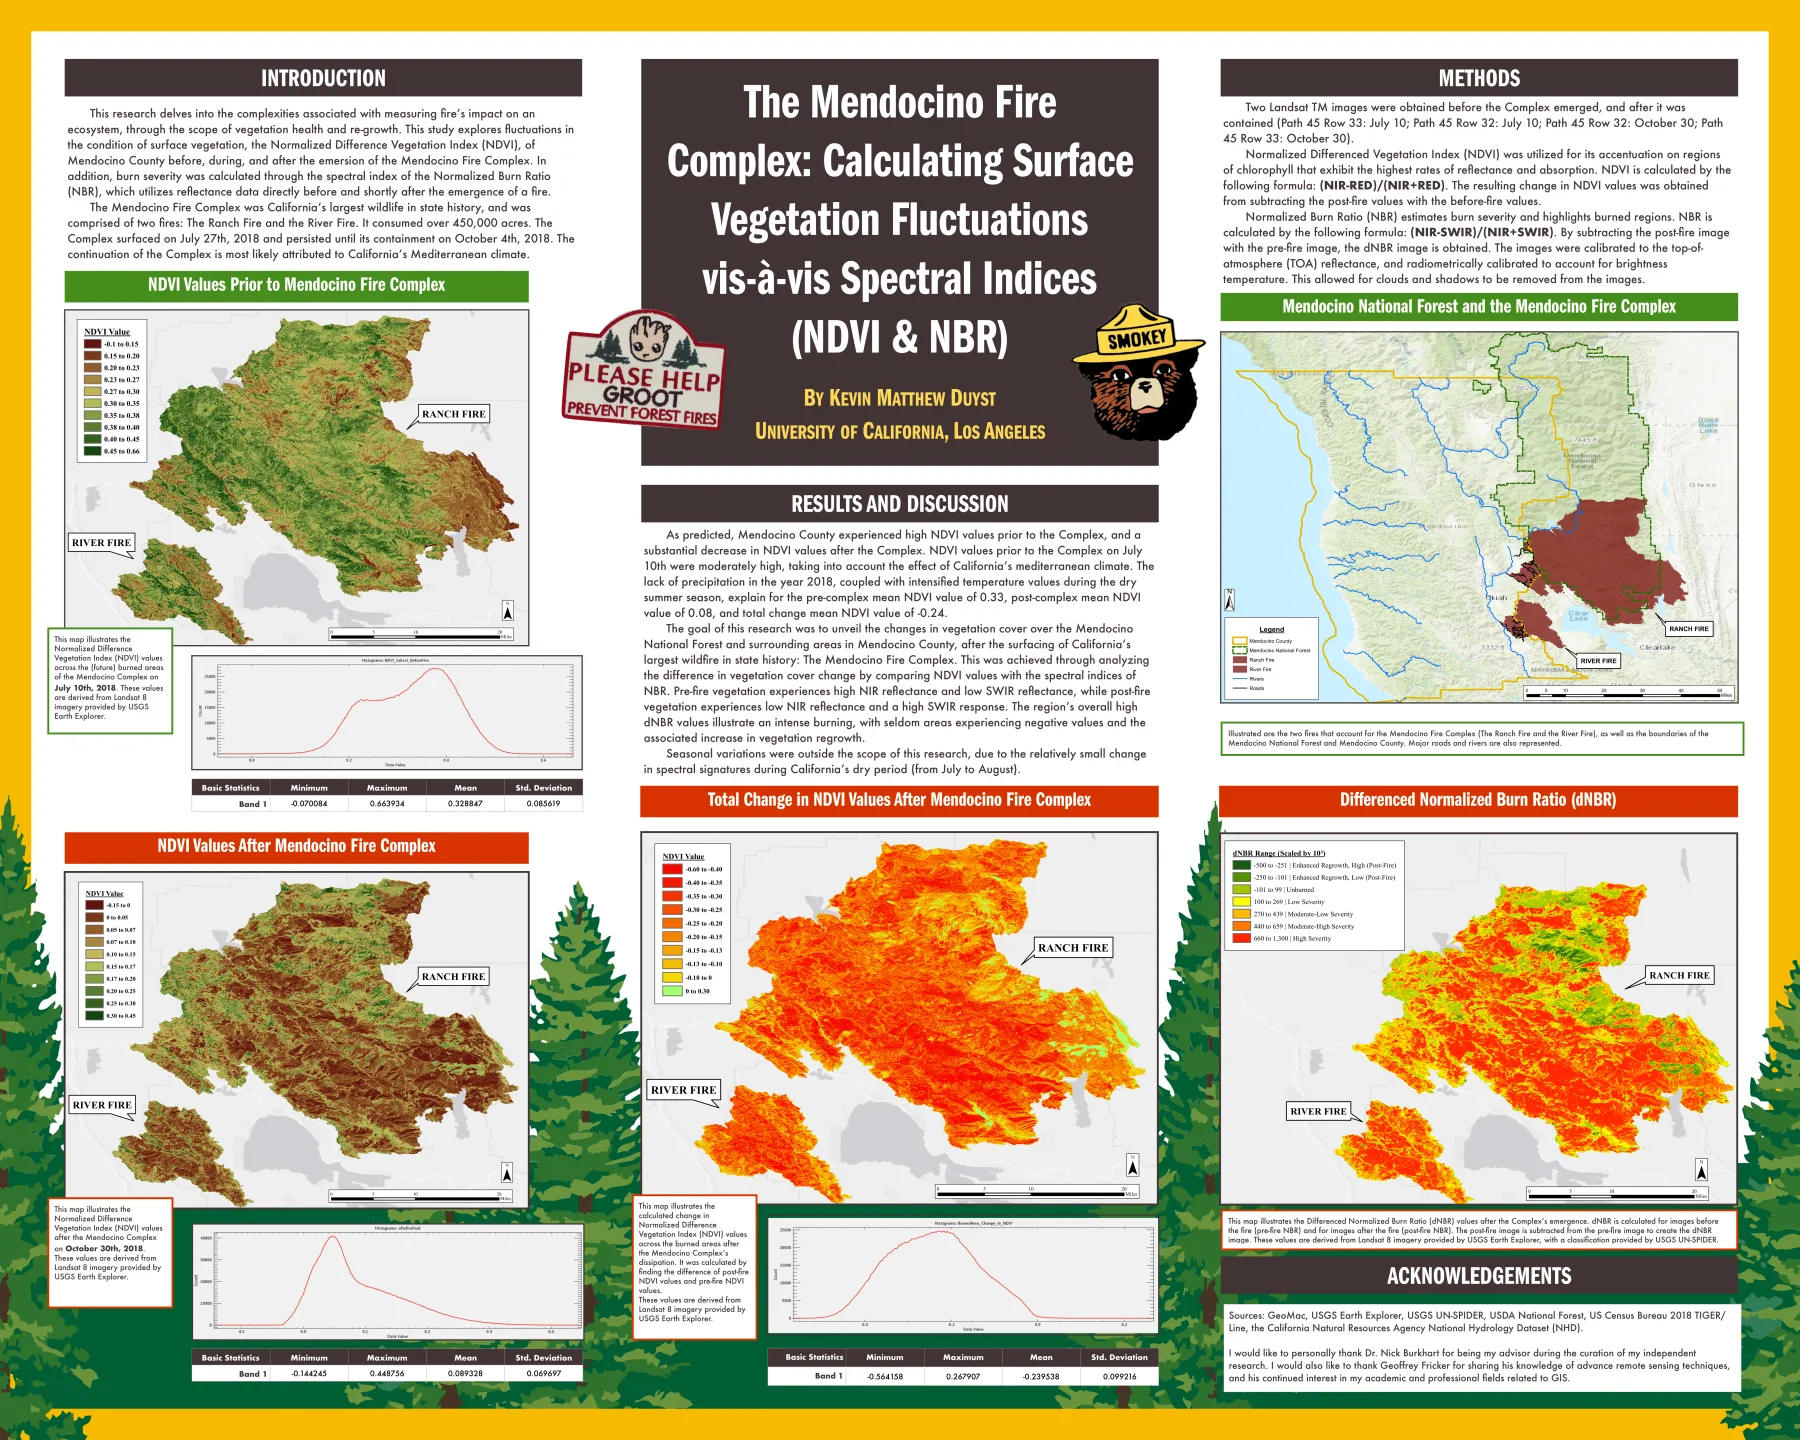
Mendocino Fire Complex: Calculating Surface Vegetation Fluctuations through Spectral Indices (NDVI & NBR) 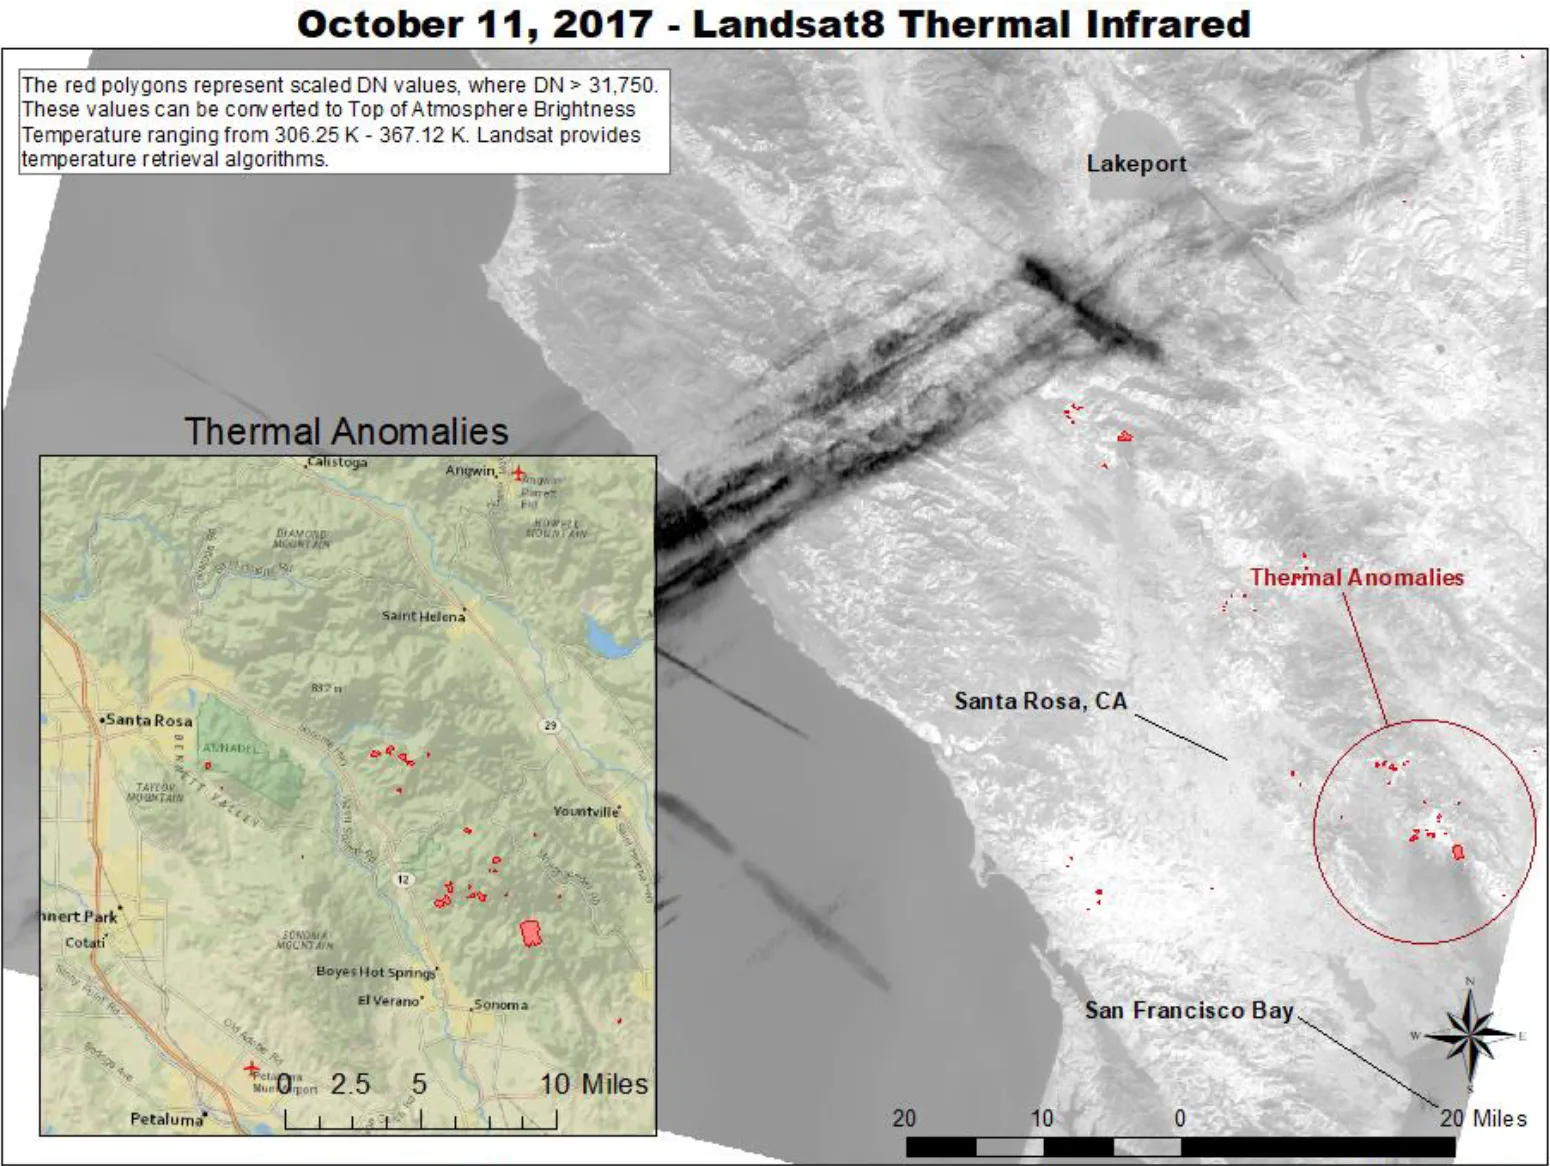
California's Most Destructive Wildfire: Mapping The Tubbs Fire (2017) 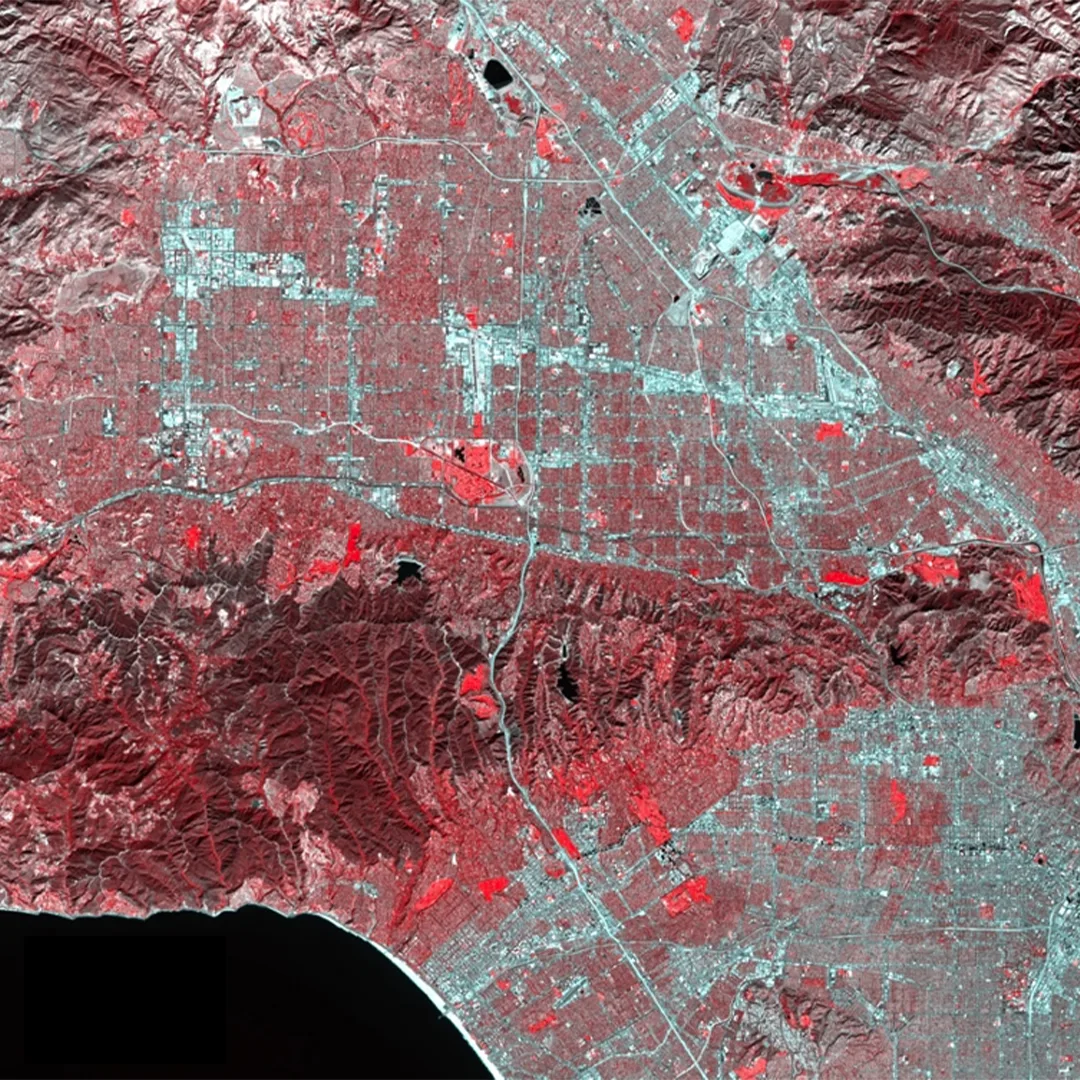
Urban Applications of Supervised Classification: Landsat vs. MODIS 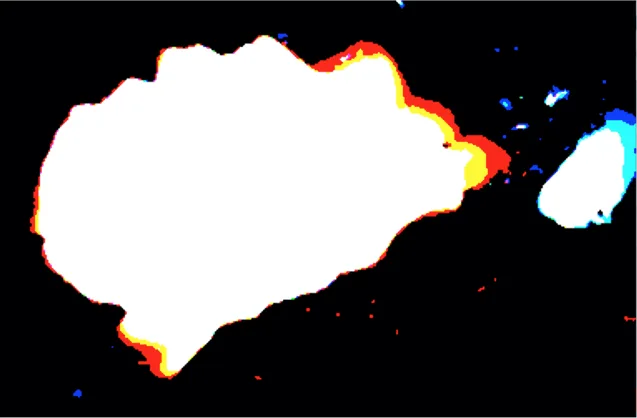
Water Resource Analysis: Lake Change Detection of the Tibetan Plateau 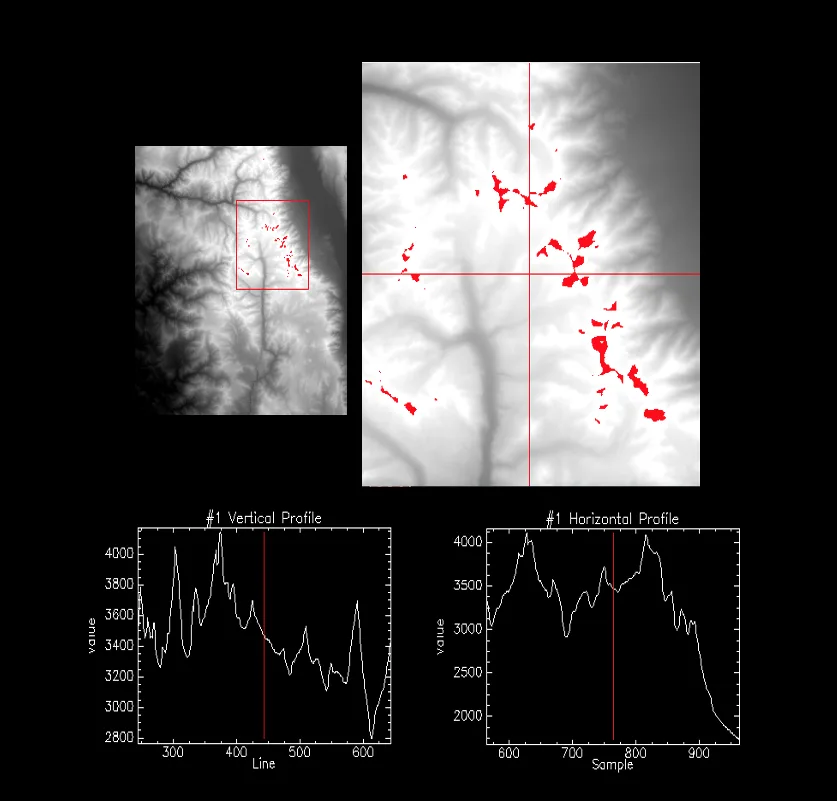
Analysis of Topographic Data: DEM of Mt. Whitney, CA using SRTM Imagery 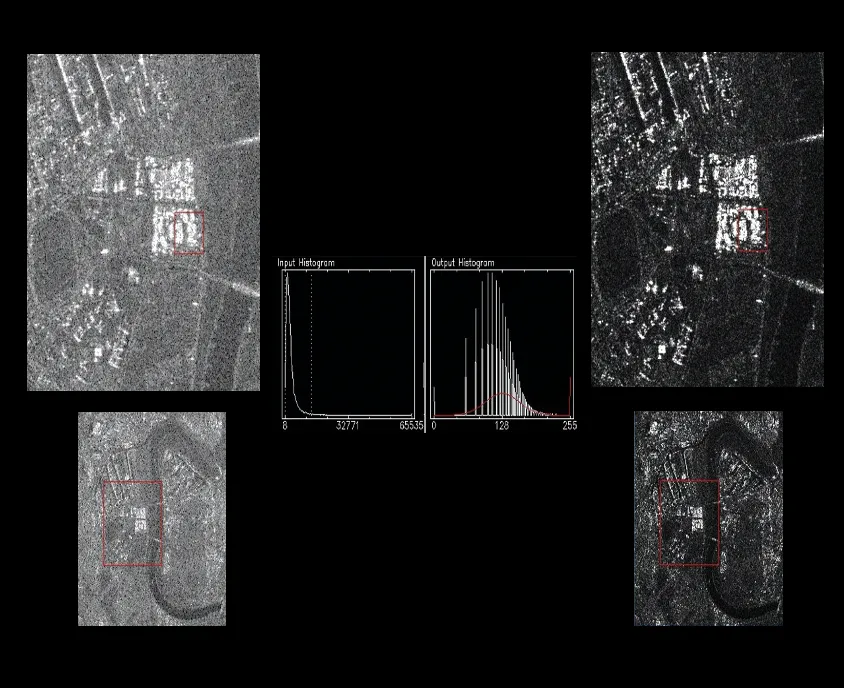
Active Remote Sensing: Interpolation & Analysis of SAR Imagery 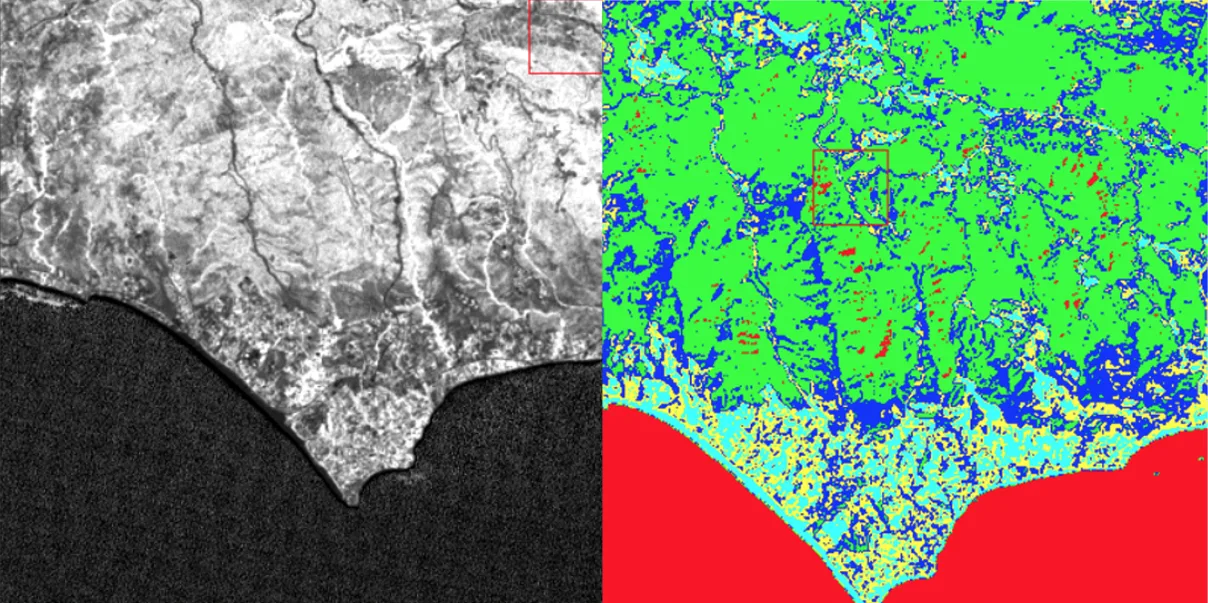
Unsupervised Classification: Land Cover Types in Los Angeles, CA 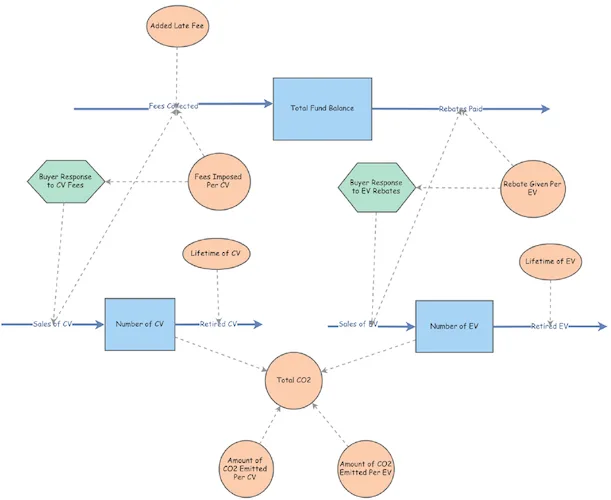 Predictive Modeling
Conceptualizing the Shift from Conventional Vehicles to Electric Vehicles: Modeling a Proposed 'Feebate Program' 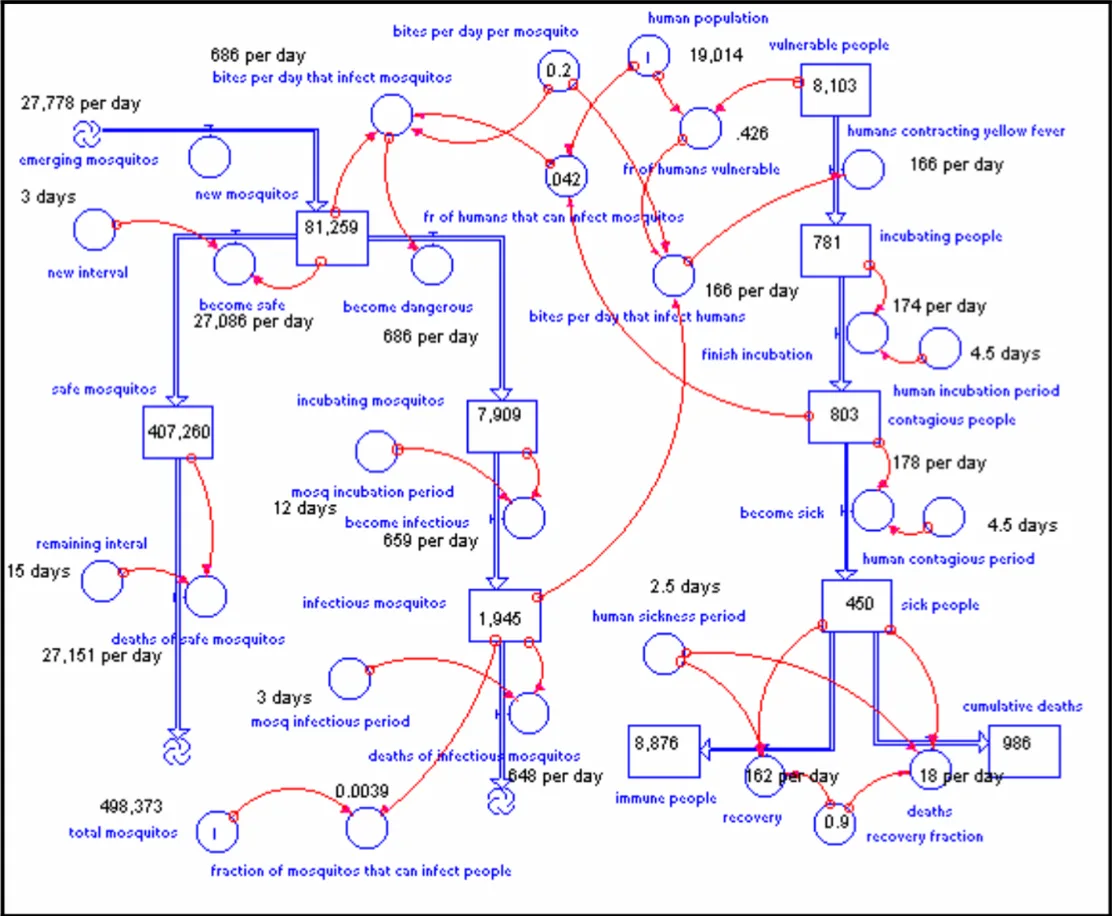
Simulating an Epidemic: Yellow Fever Modeling in Veracruz, Mexico 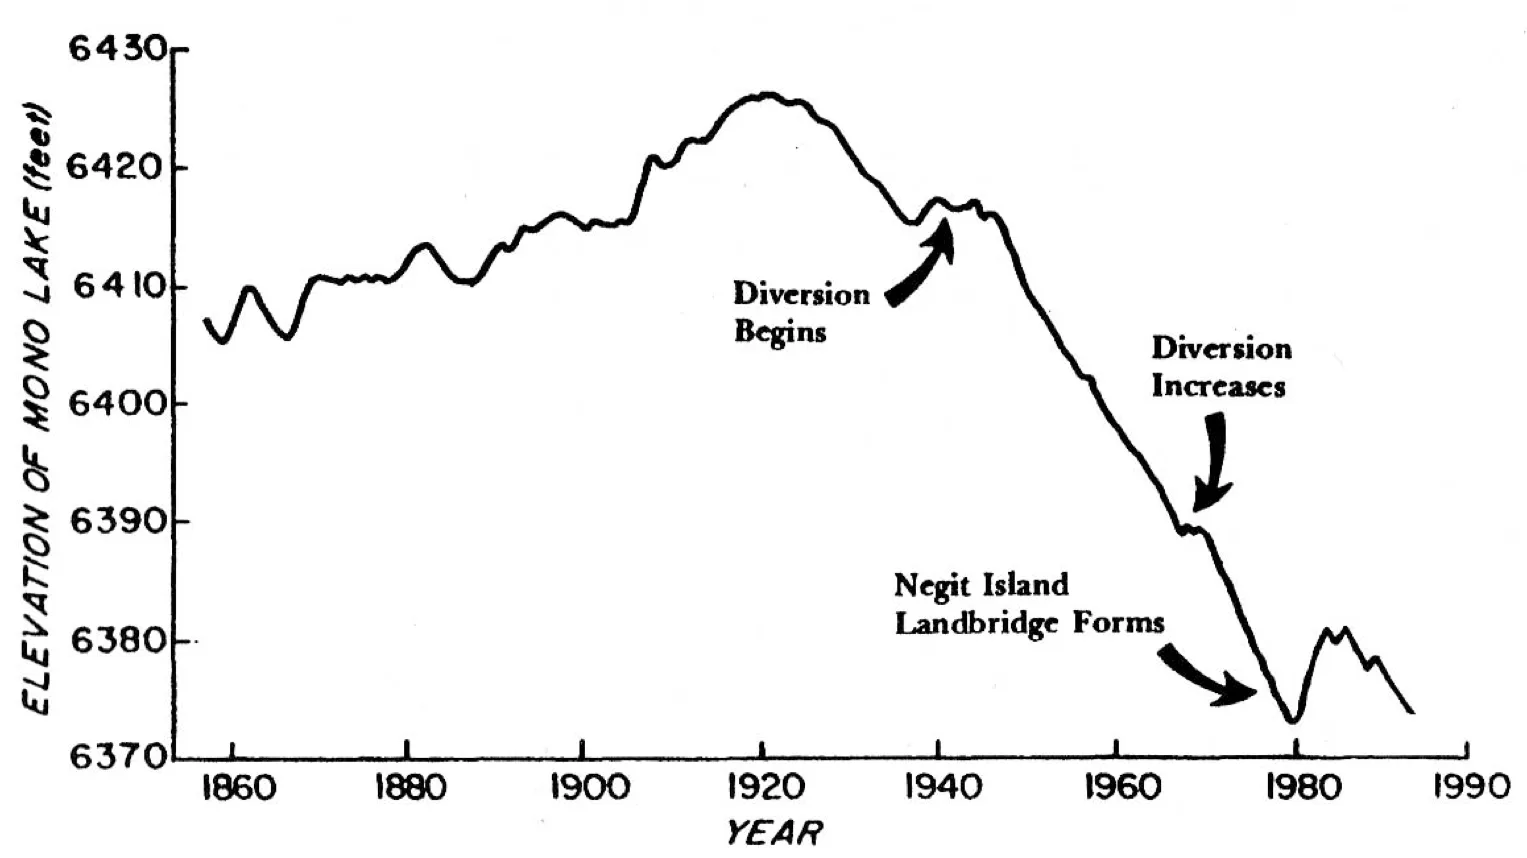
Modeling the Oasis of the Dry Great Basin: Predicting Water Values of Mono Lake 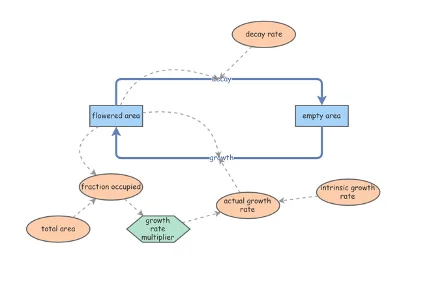
S-Shaped Growth: Modeling the Natural System of a Flowered Area 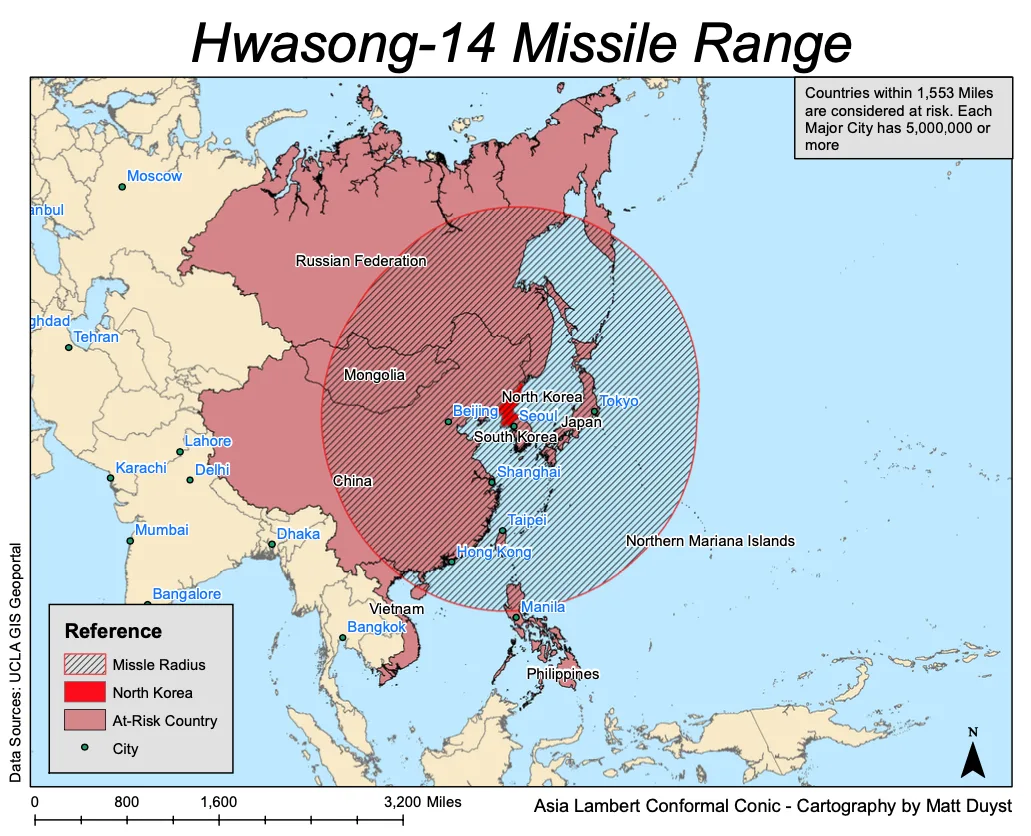 SQL & Buffer Analysis
Comprehending the Range of North Korea's Strongest Missiles 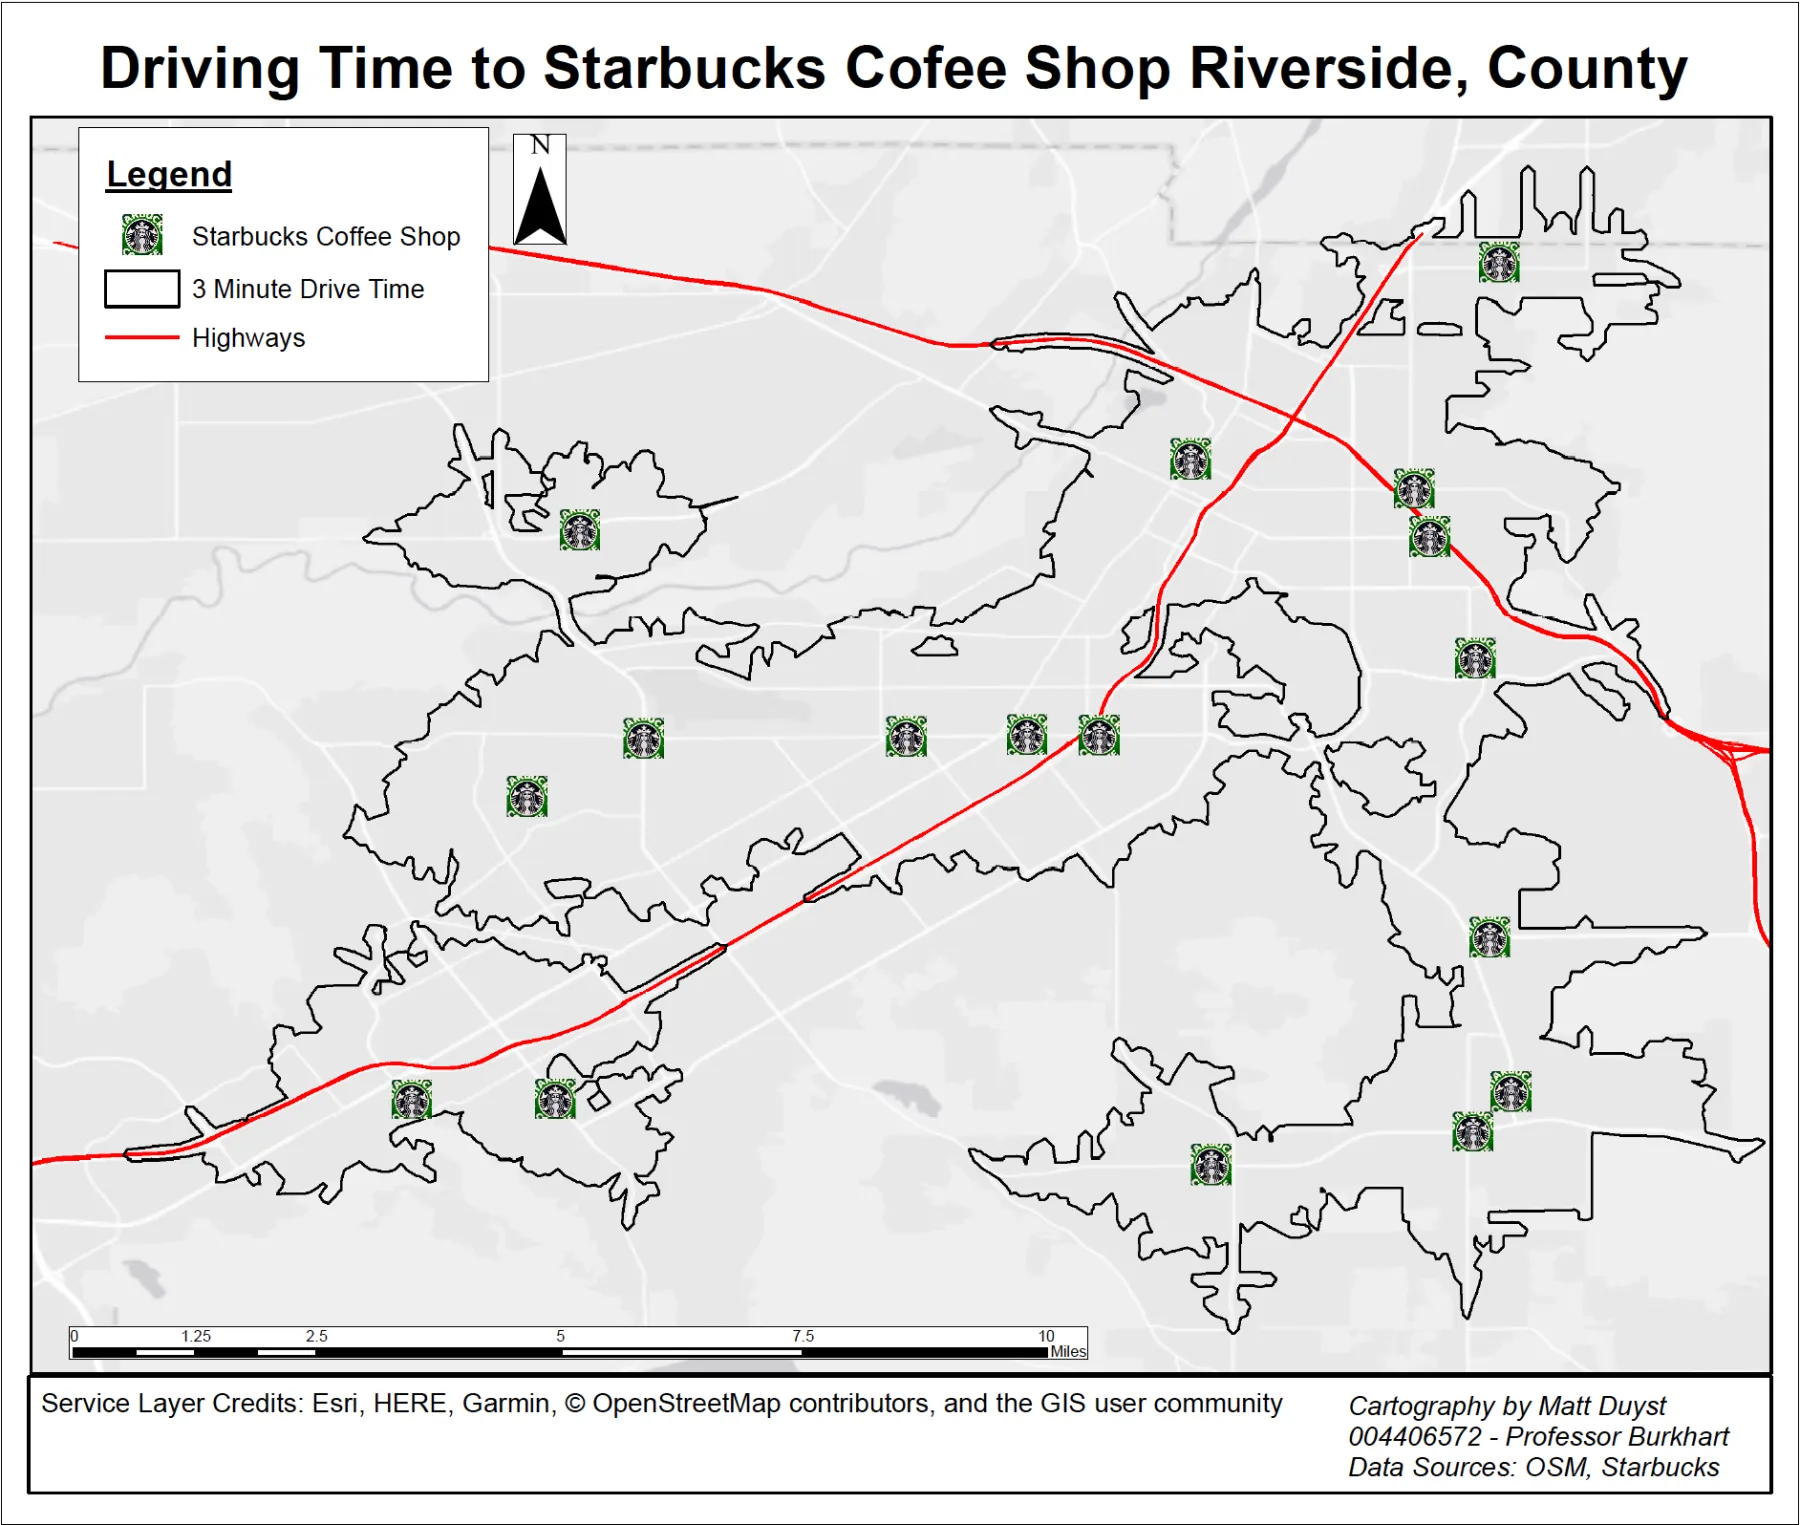
Starbucks' Key to Success: Demographic Considerations for Ideal Store Locations in Riverside County, CA 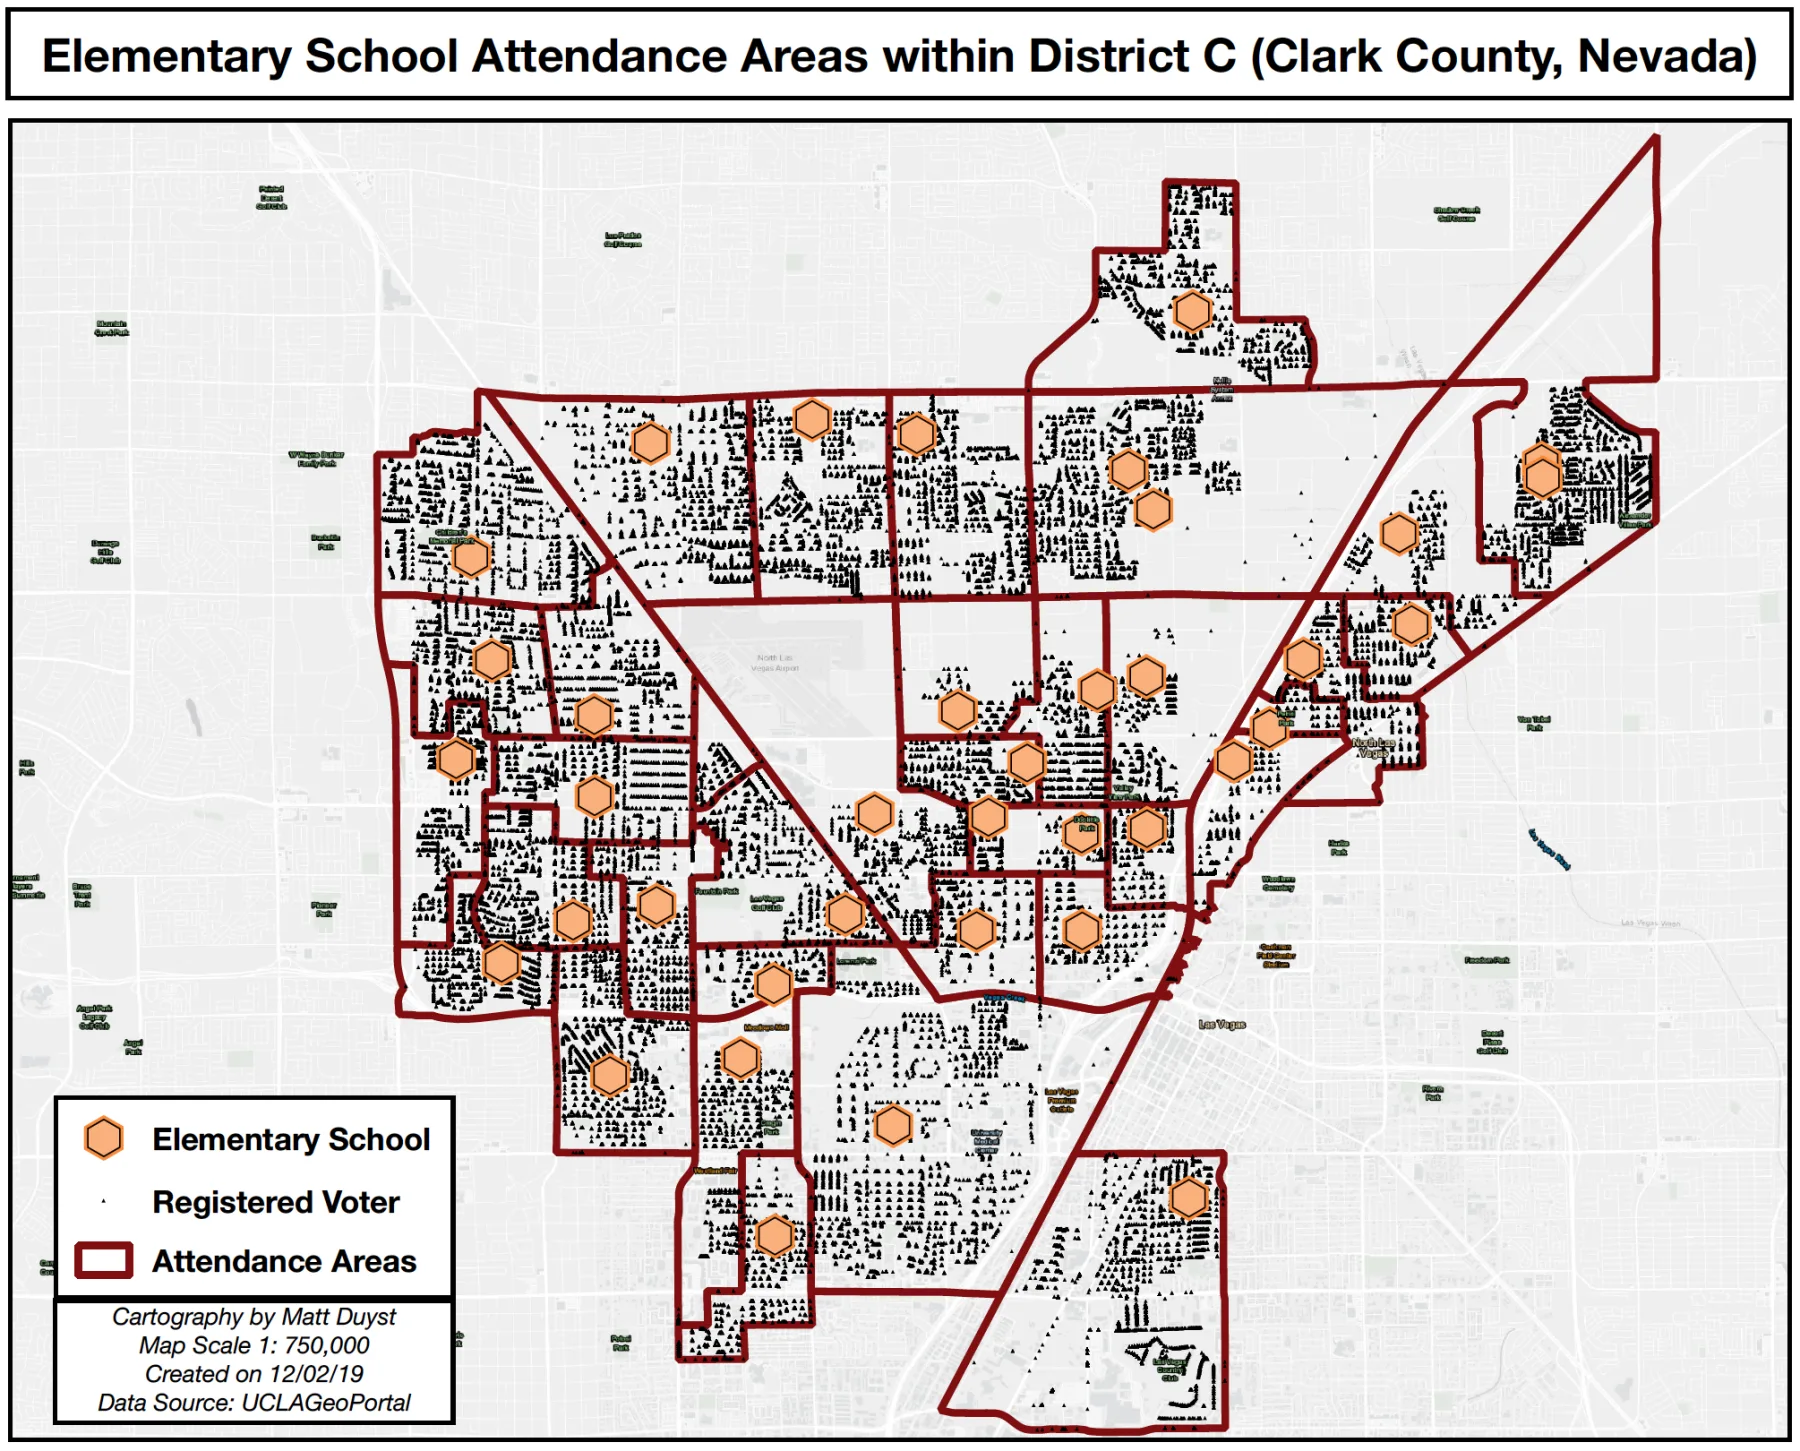
Elementary School Attendance & Number of Registered Voters Per School District: Minimizing Classroom Sizes Clark County, NV 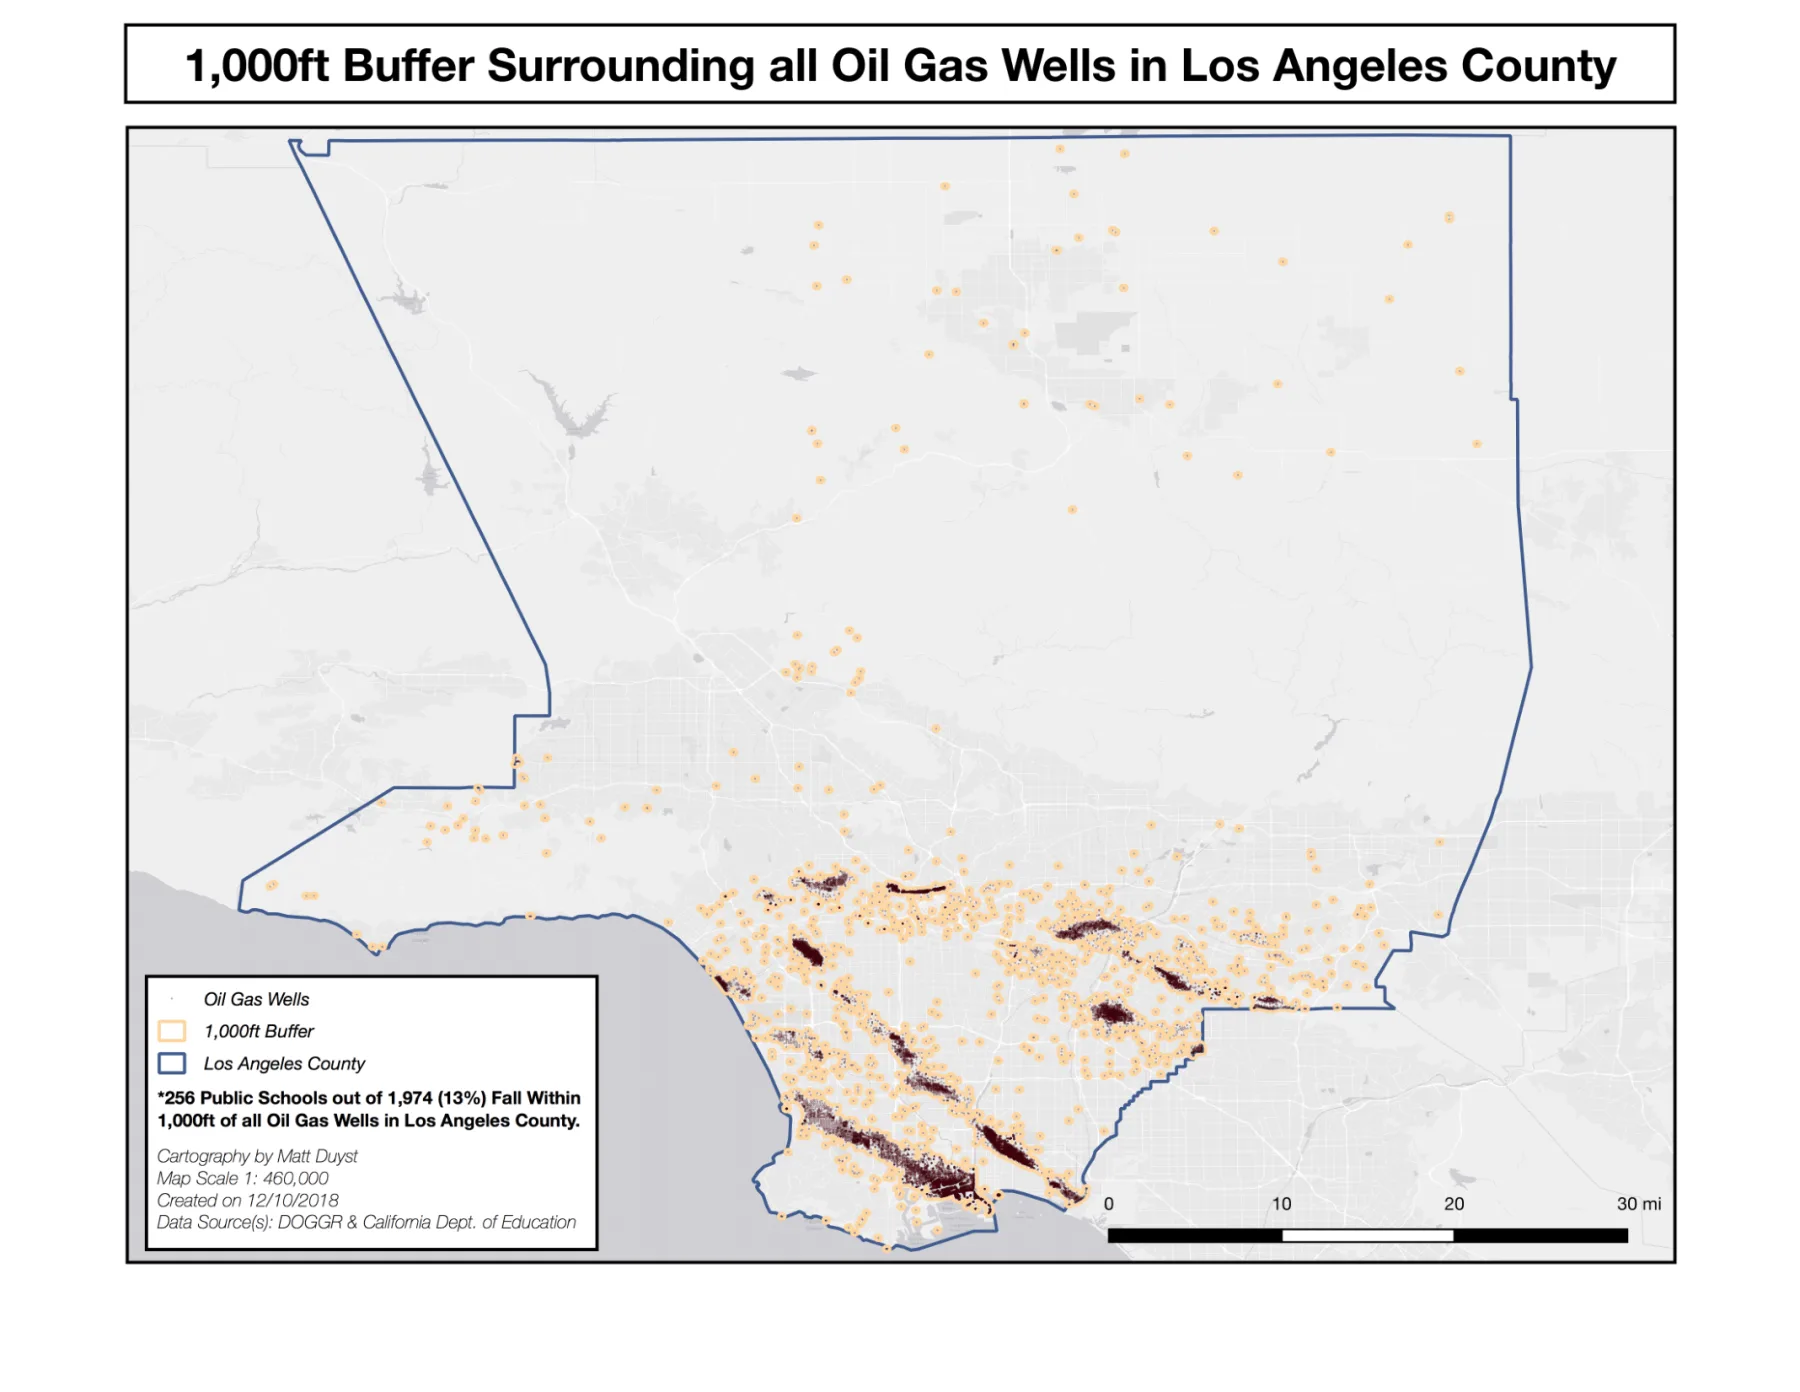
Public School and Oil Gas Well Assessment in Los Angeles, CA 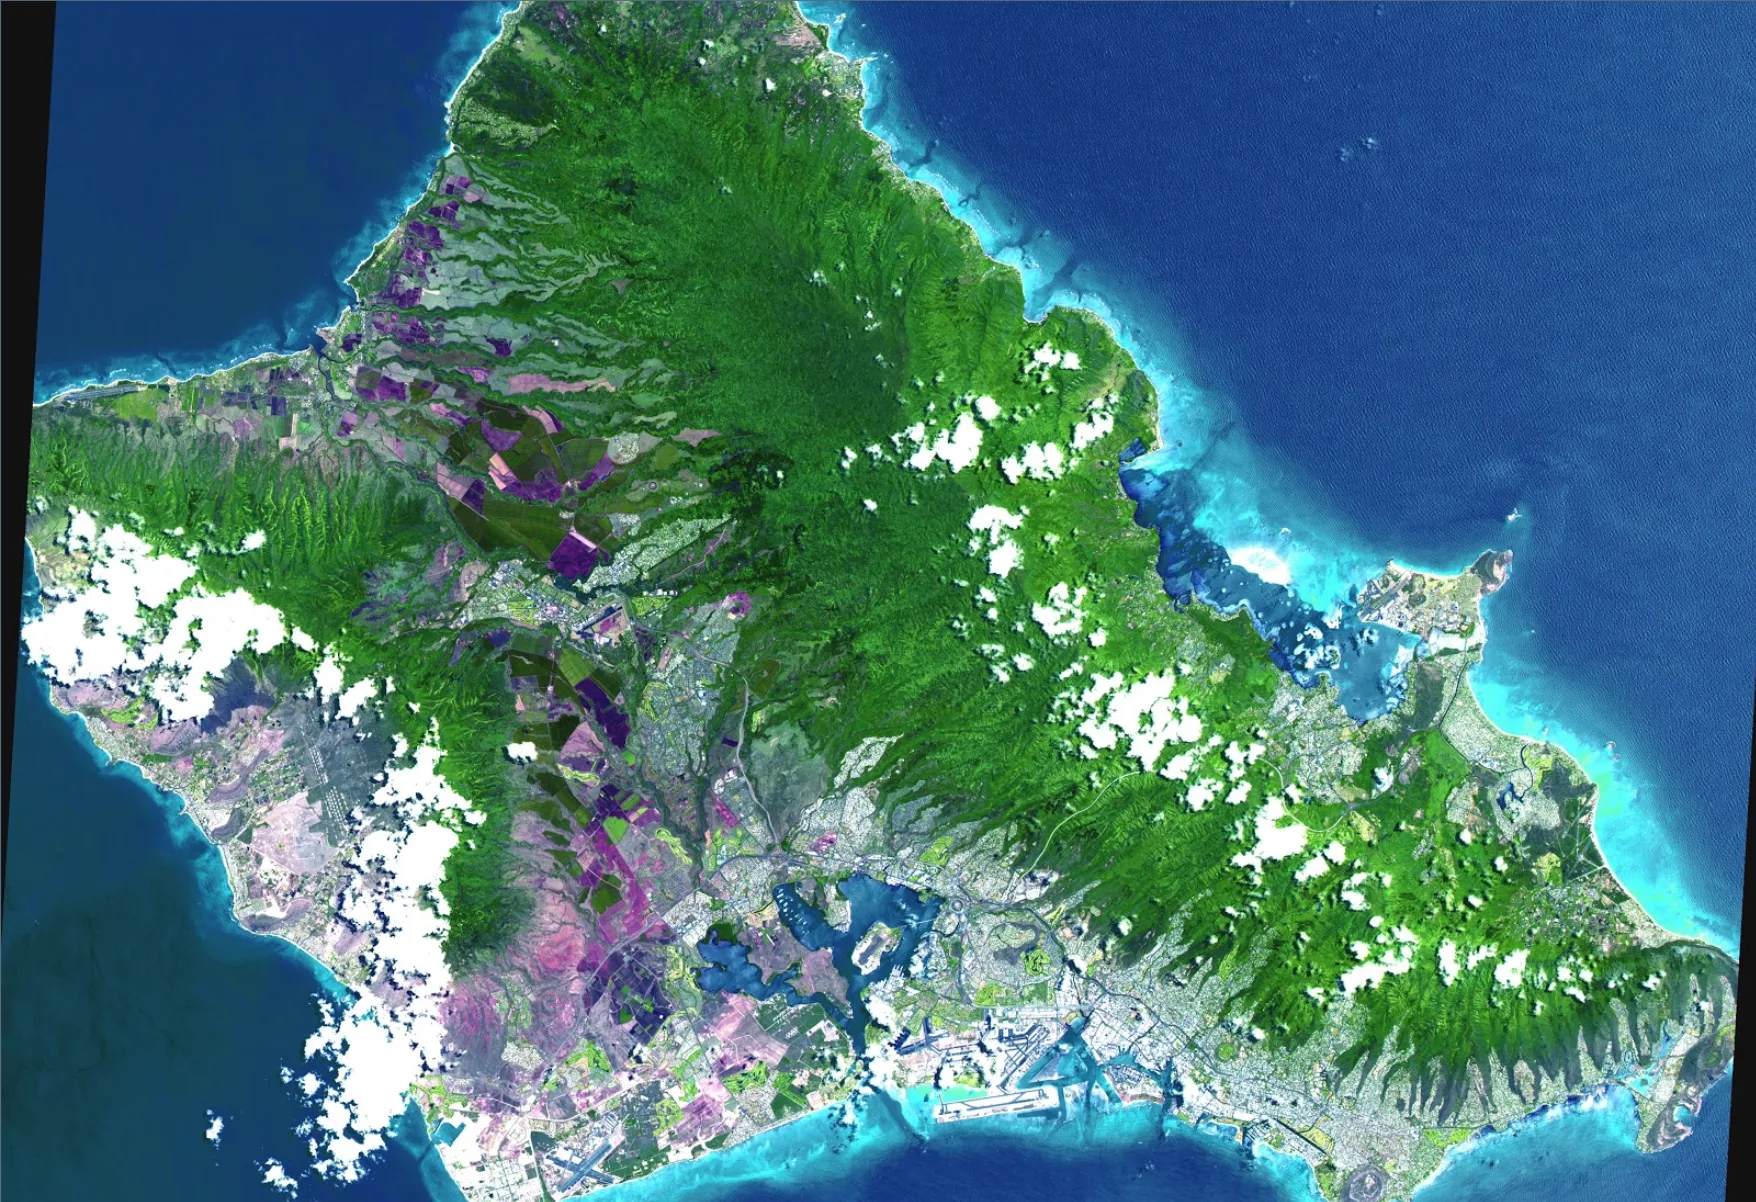 DEM
DEMThree-Dimensional Mapping of Natural Disaster Scenarios: Leilani Estates, HI (2018) 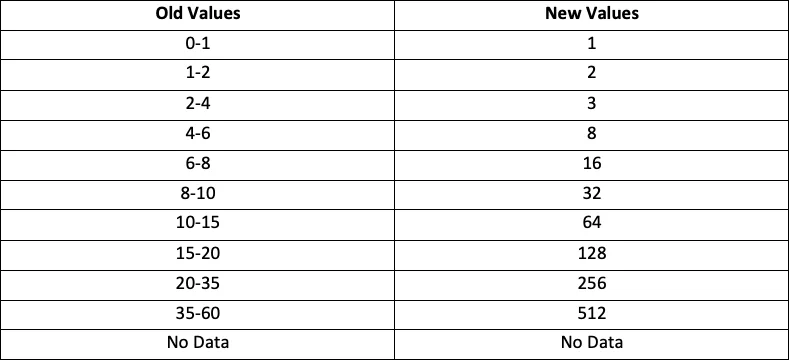
Bridging the Darién Gap: A Cost-Distance Analysis of Yaviza to Chigorodo and Apartado 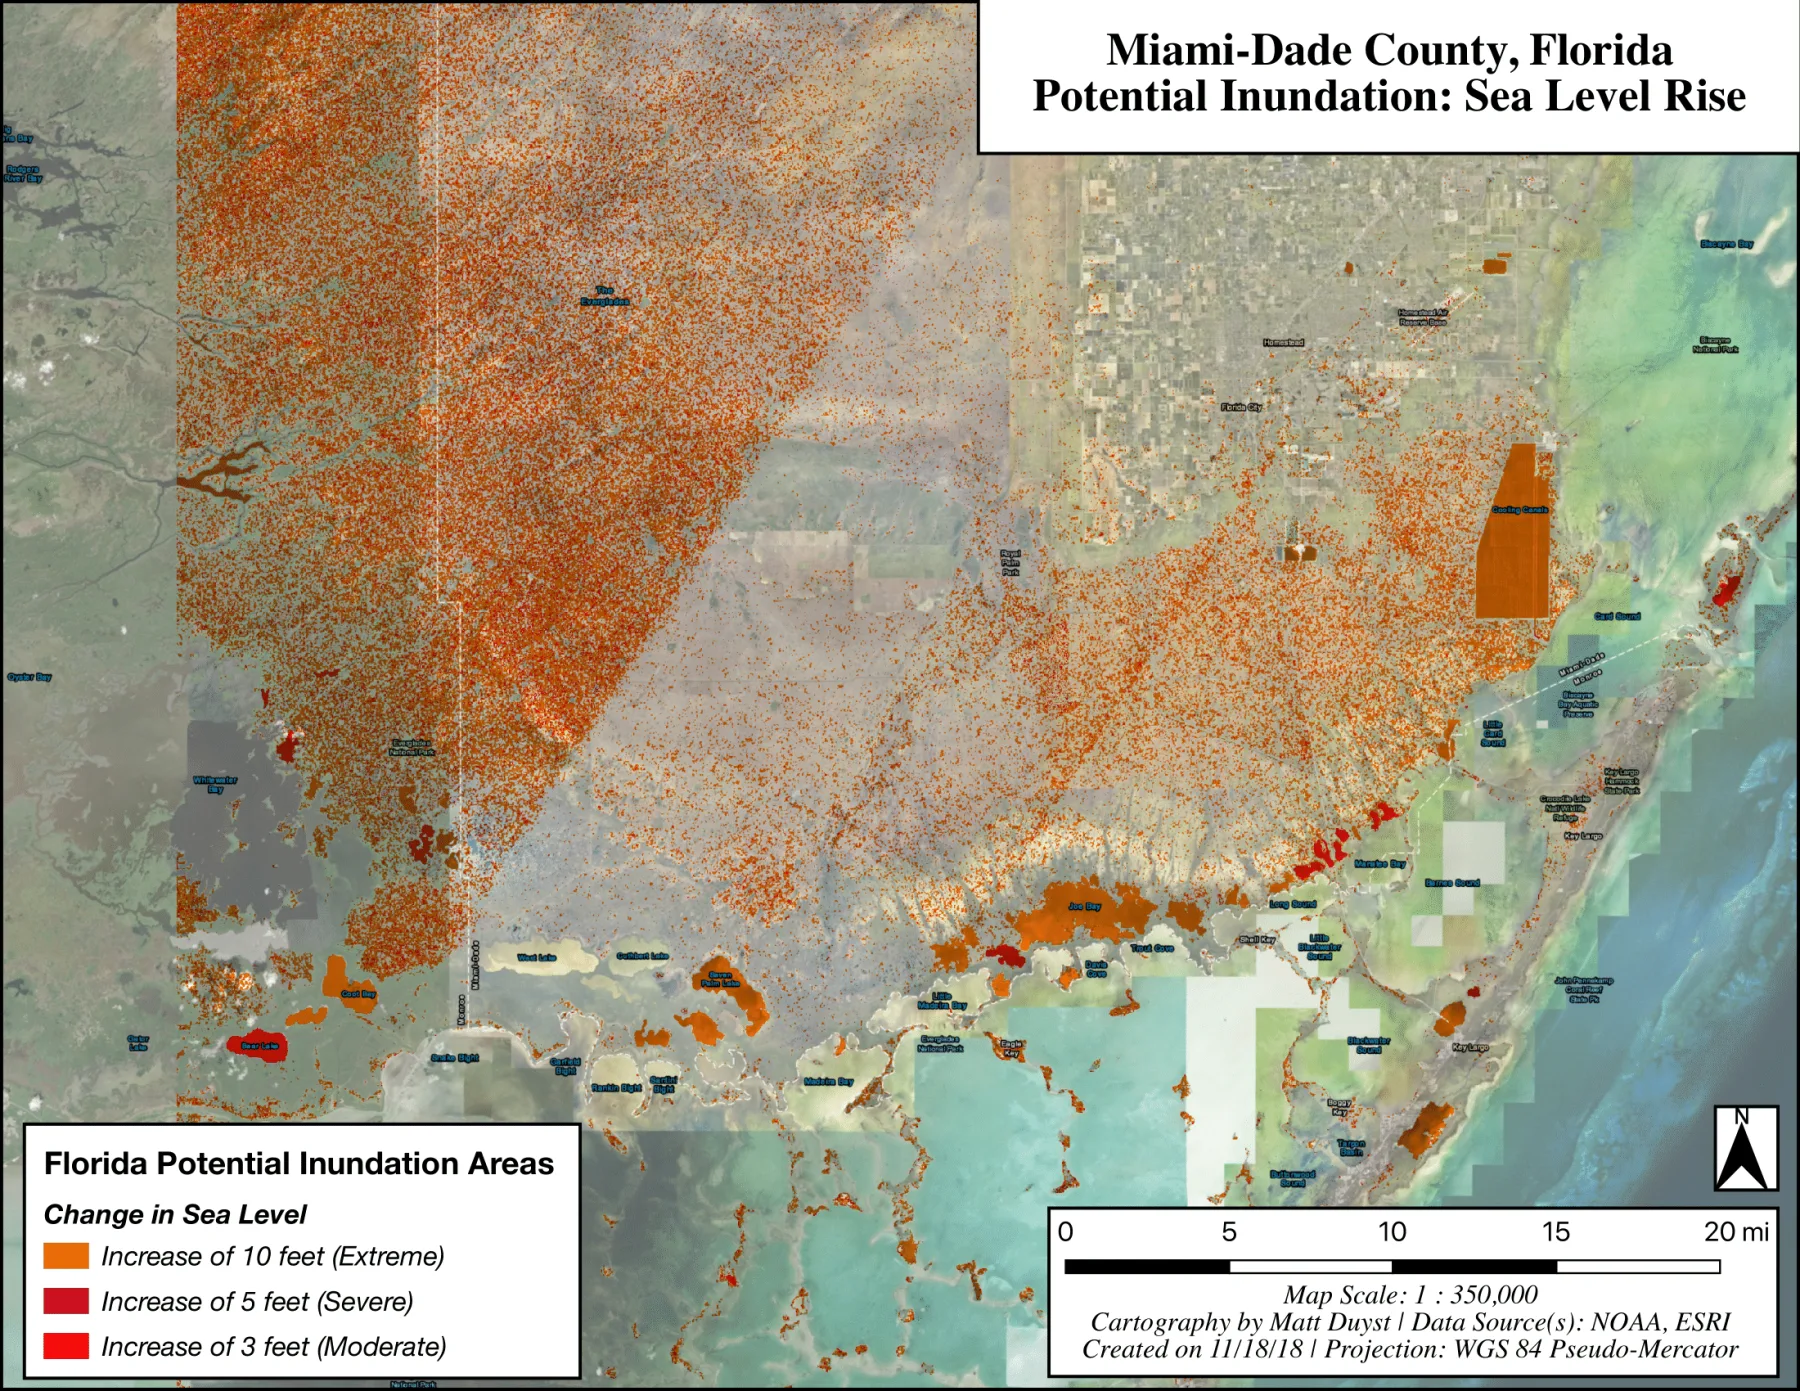
Potential Inundation: Sea Level Rise in Miami-Dade County, Florida 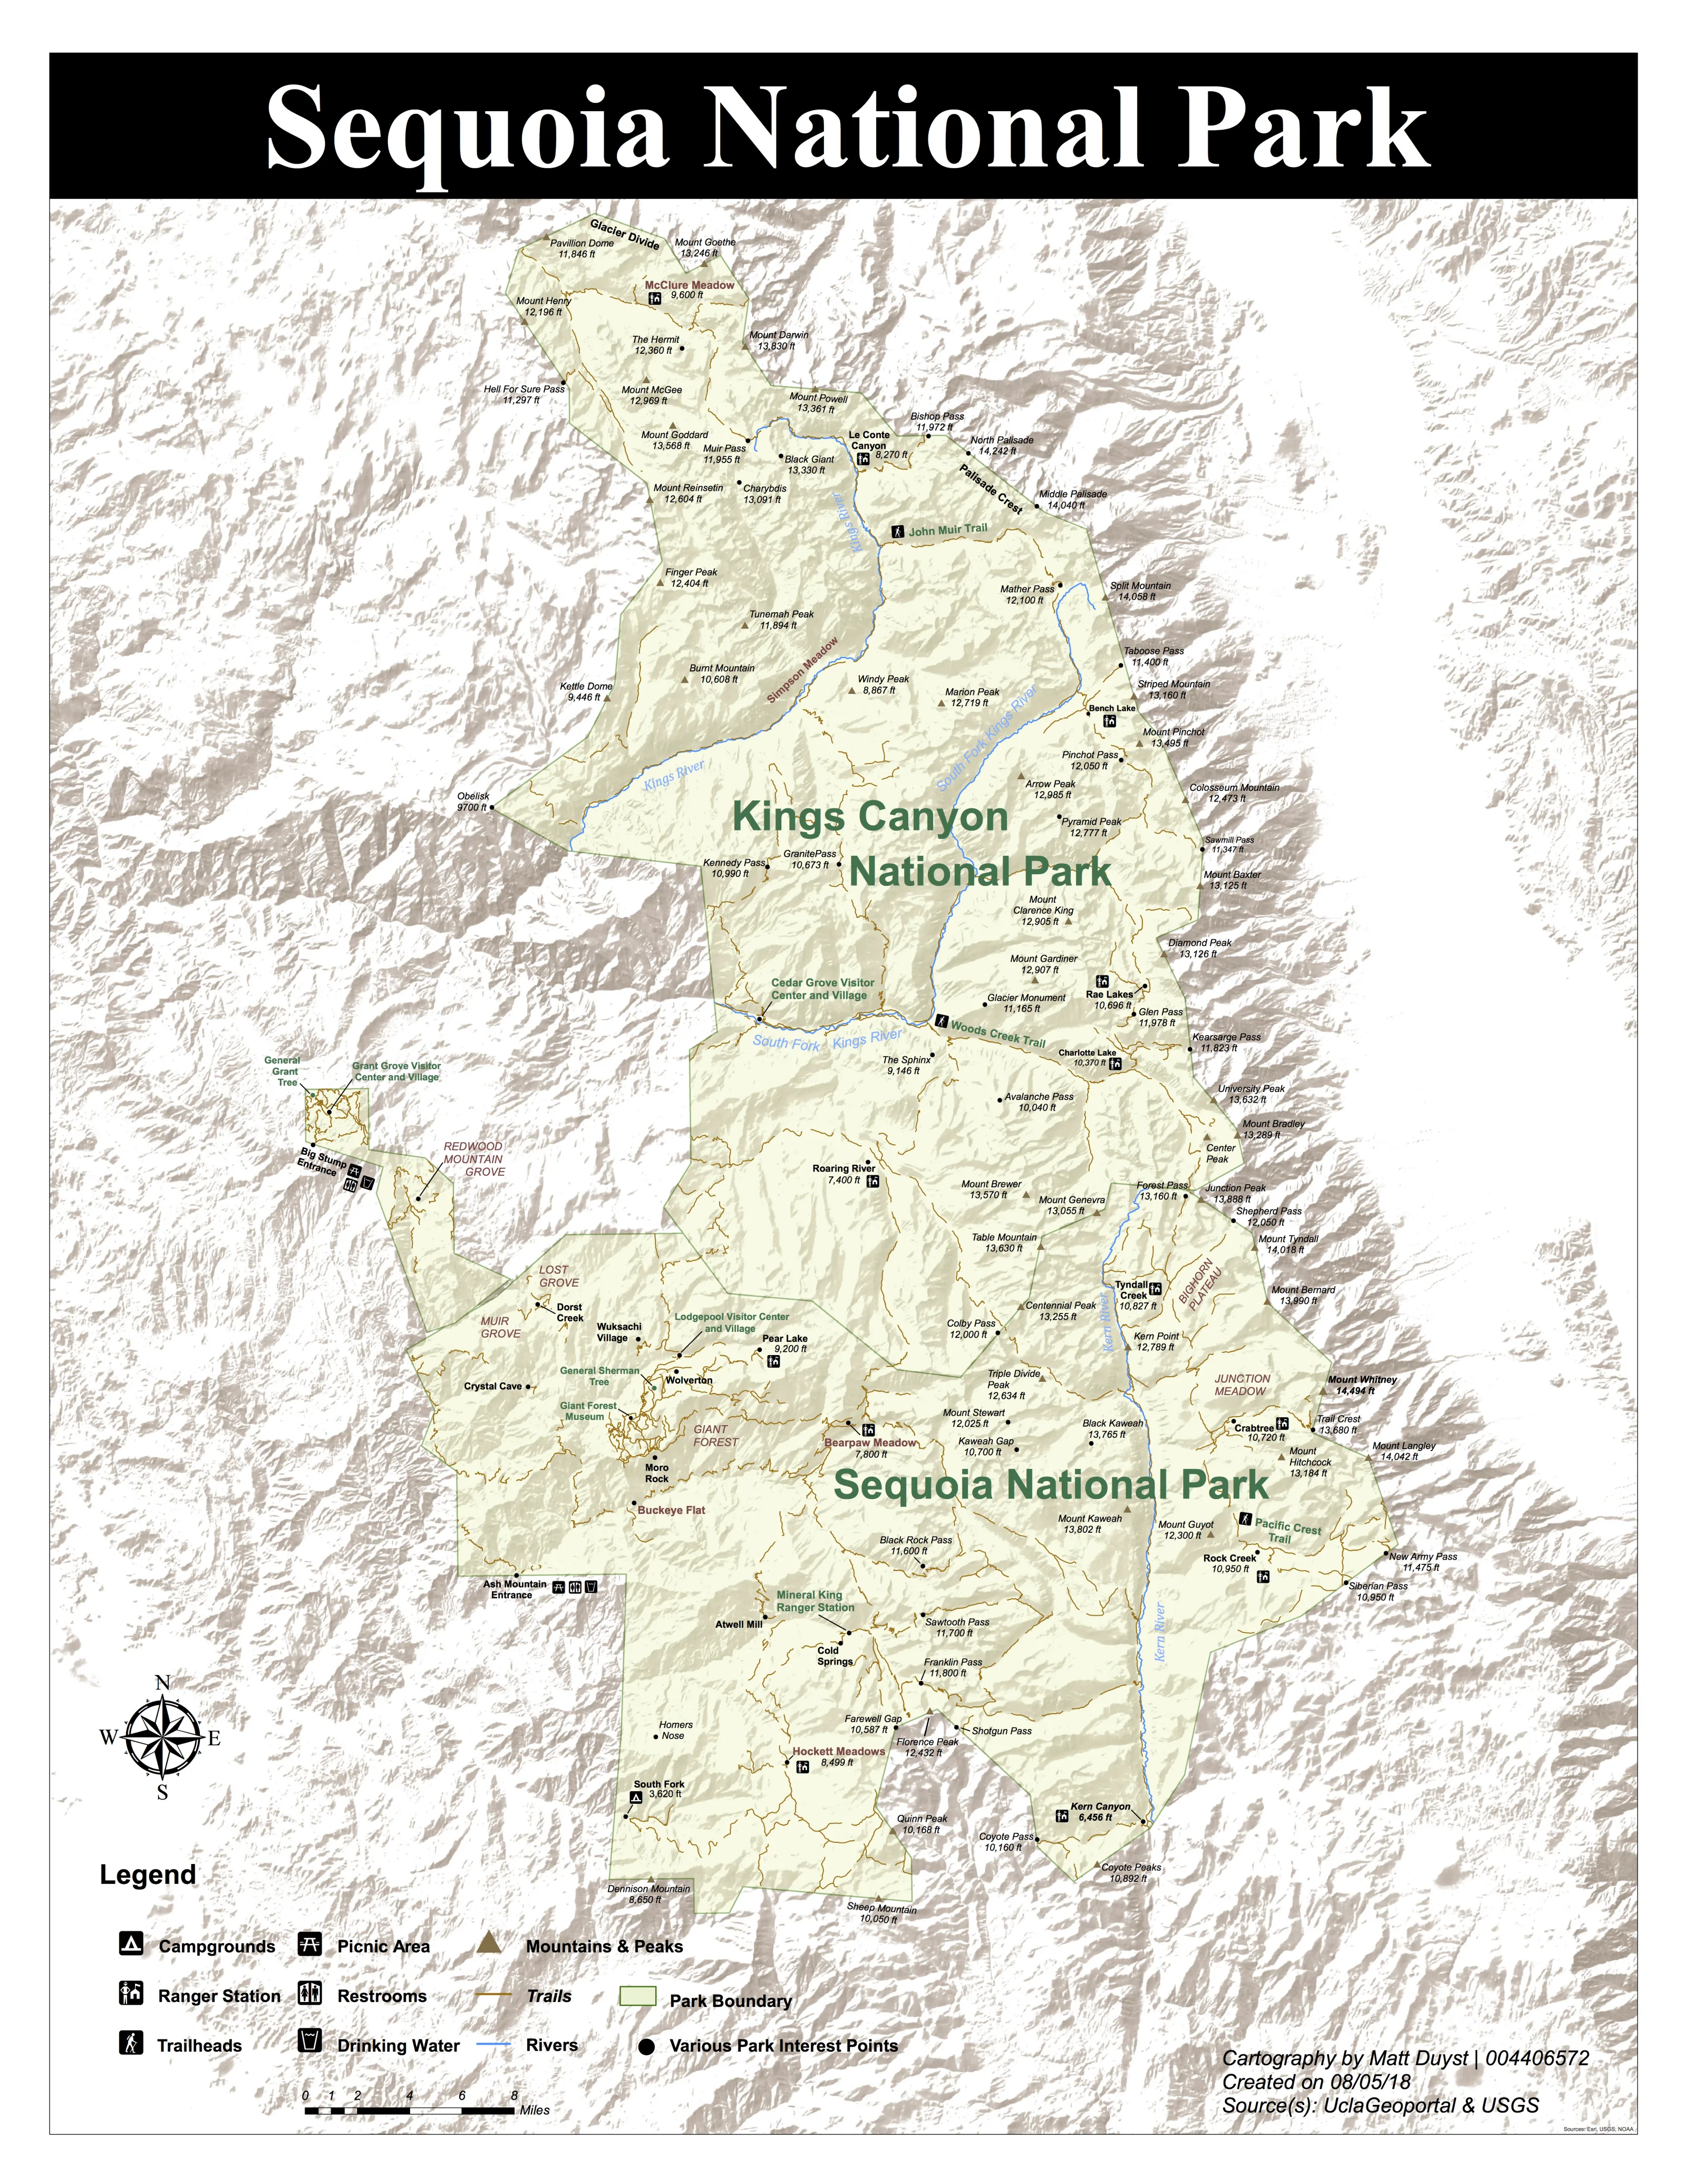 Cartography
A New Design for Sequoia National Park: The Ideal Cartographic Relief Map 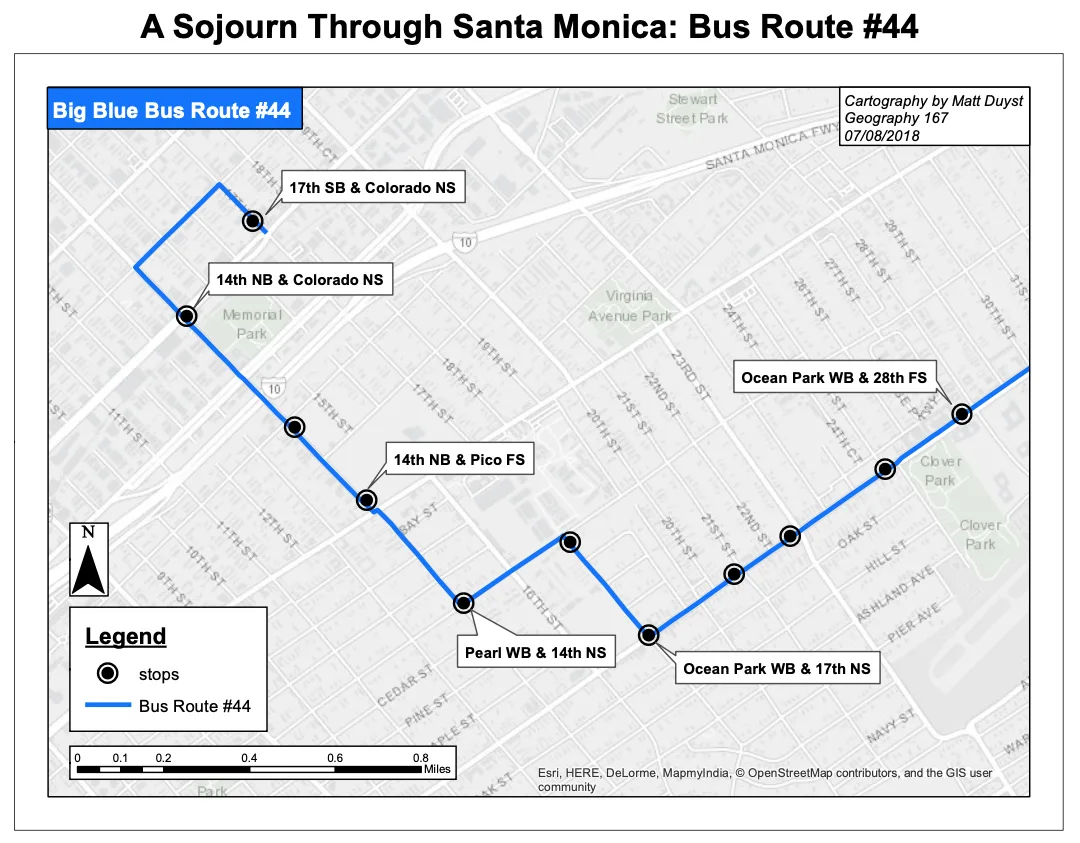
Re-Designing LA's Bus Routes: Big Blue Bus #44 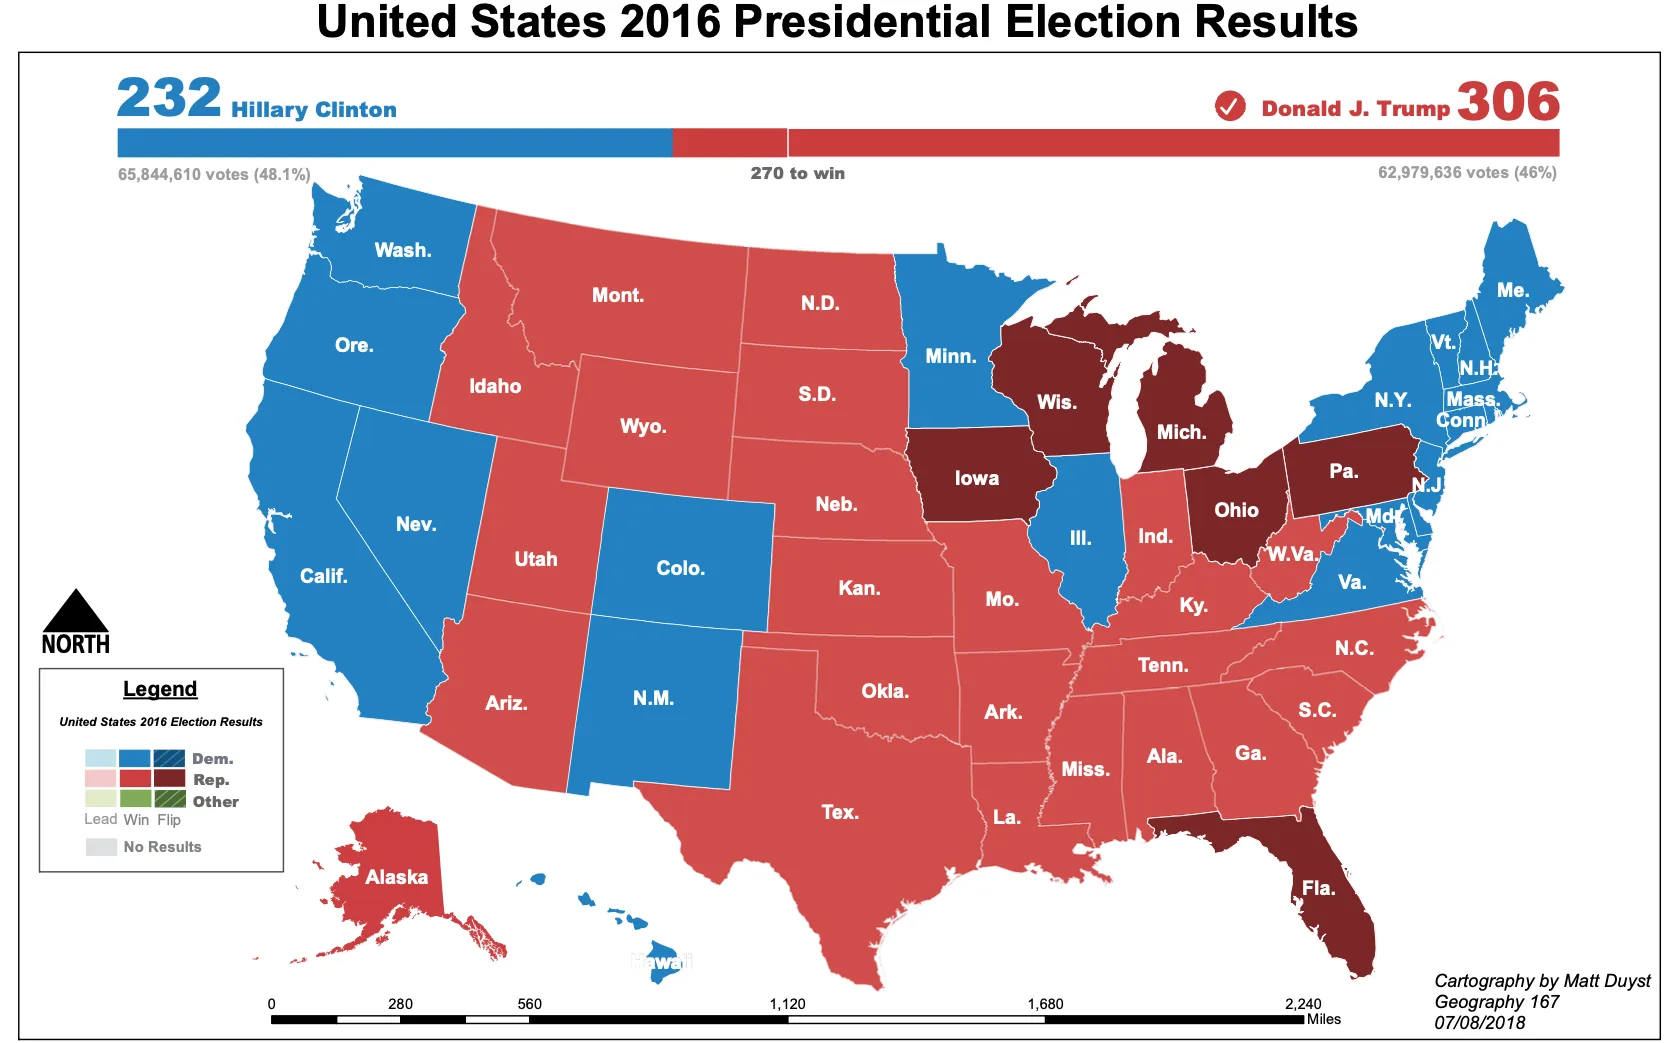
Recreating the 2016 Presidential Election: A Nation Divided 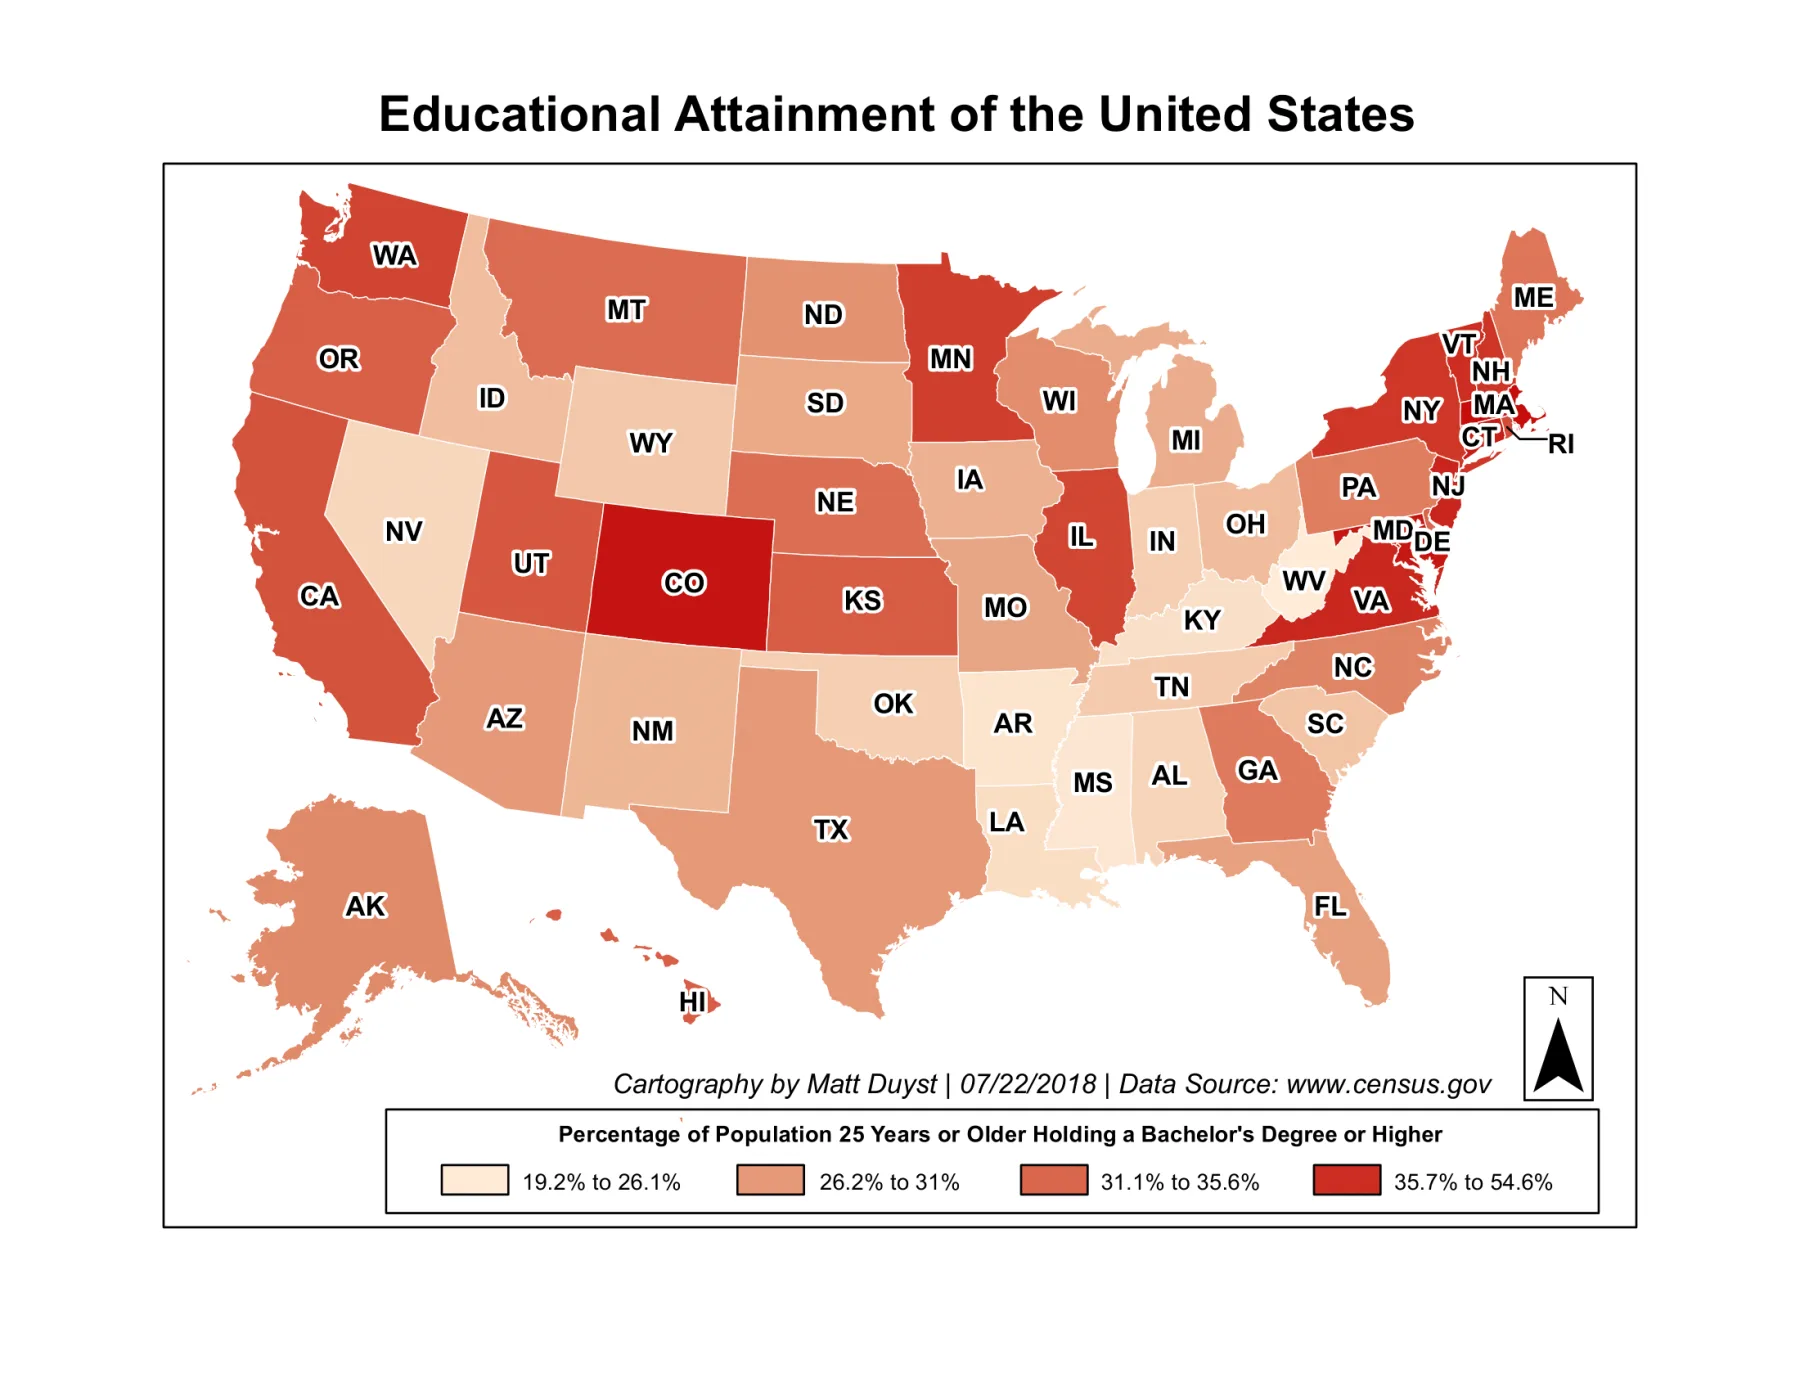
Variables of Statewide Thematic Mappings 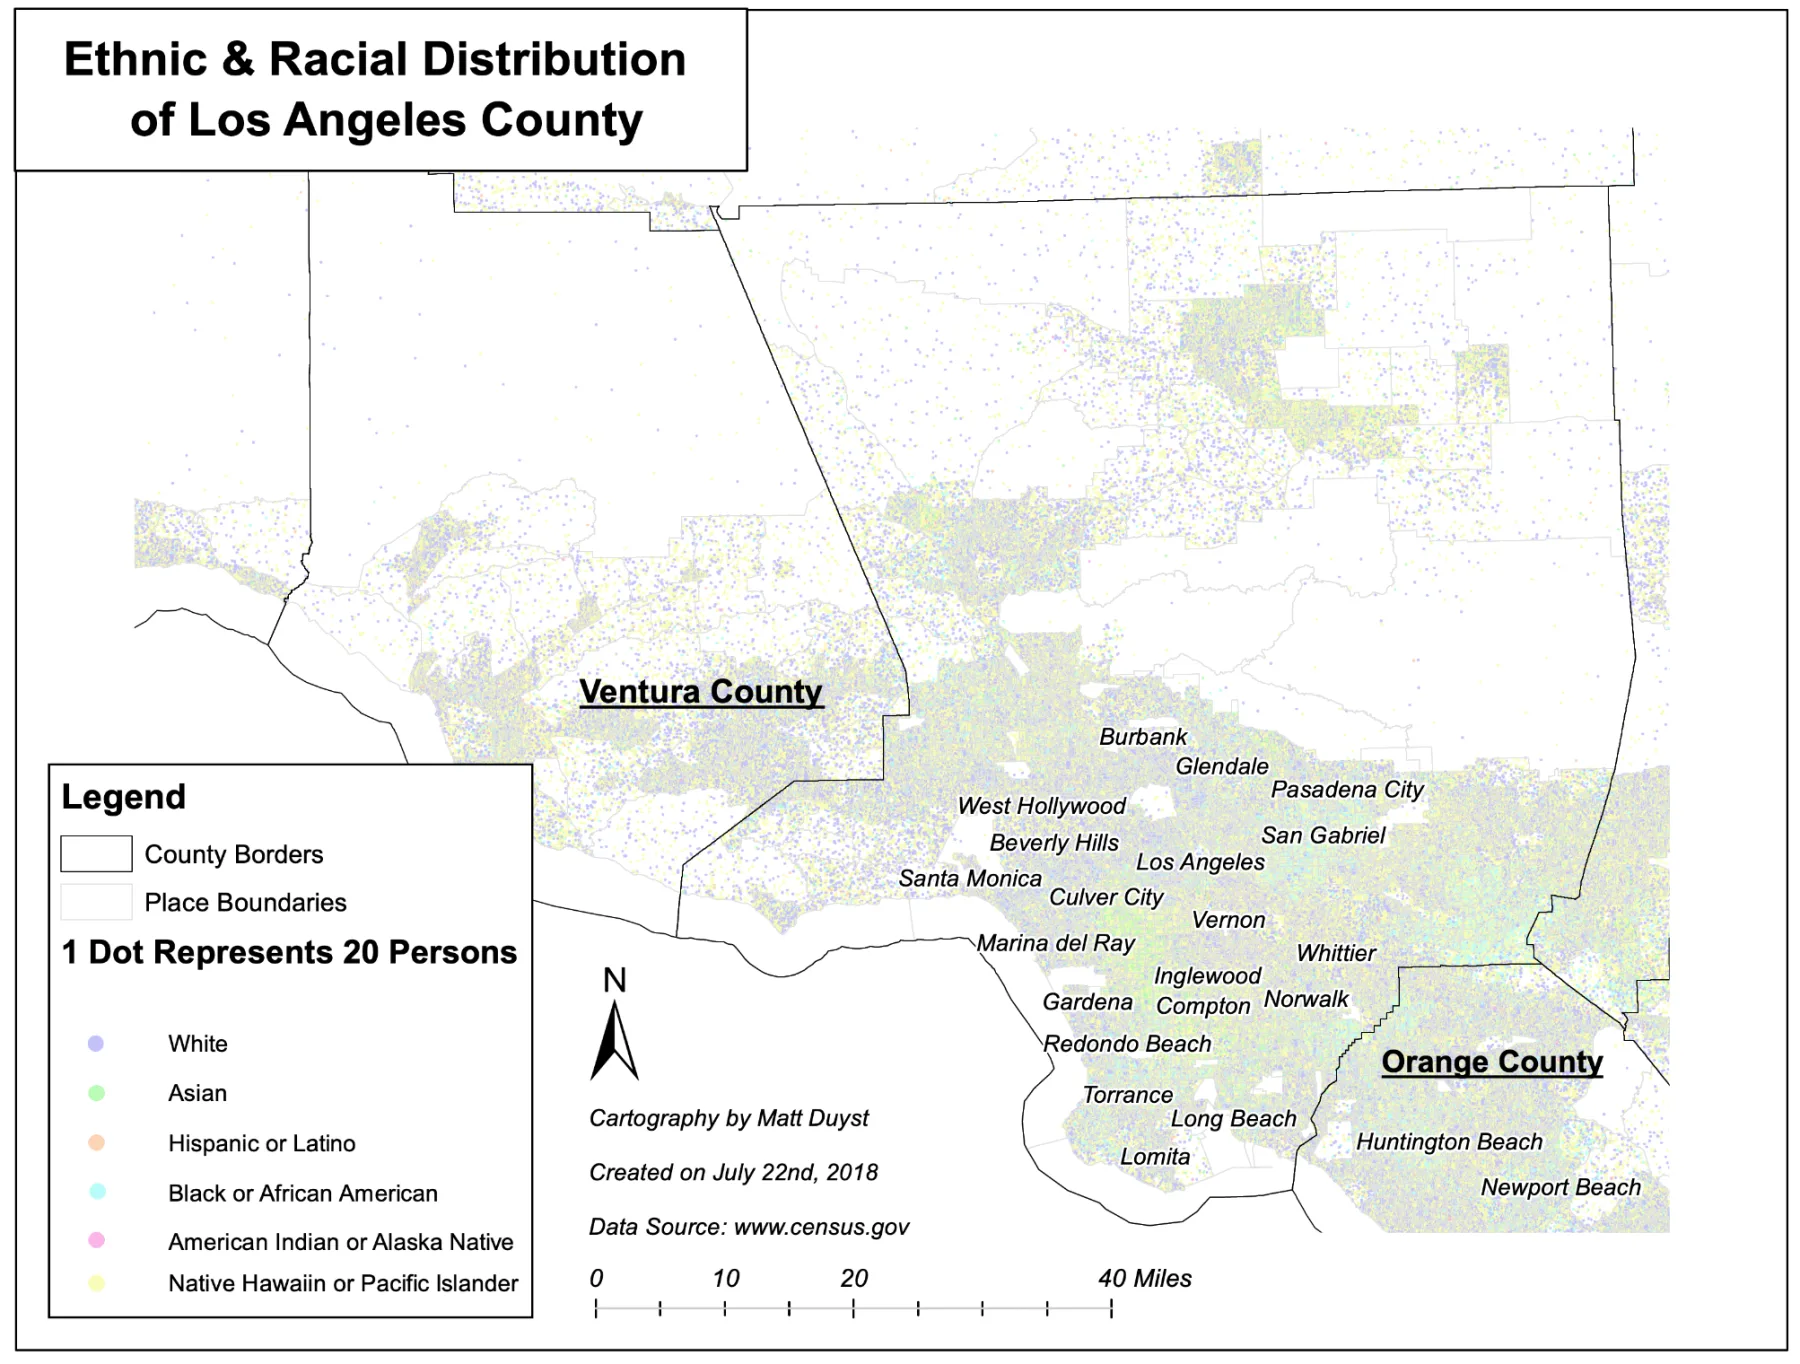
A Dot-Density Representation of LA's Ethnic & Racial Distribution 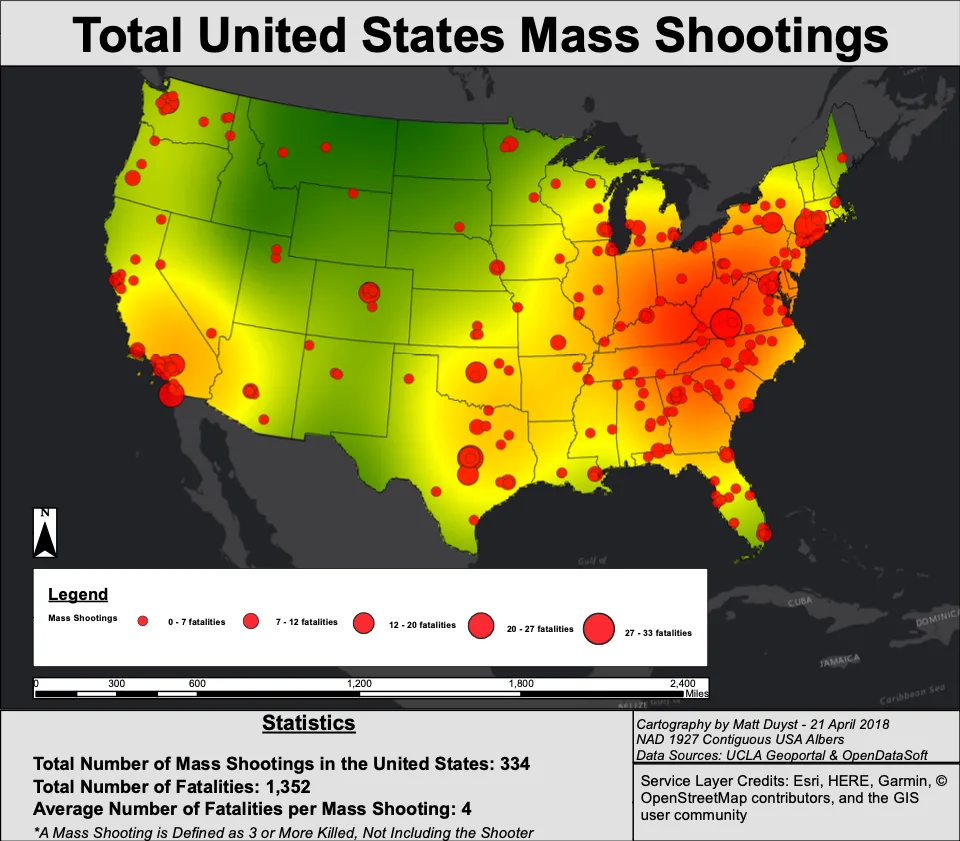 Raster Analysis
US Mass Shootings: Forces of Prediction, or Varying Inconsistencies? 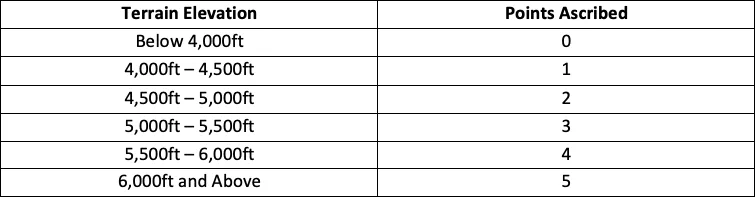
Site Suitability Analysis: San Diego Elevation Mappings for a Summer Campground 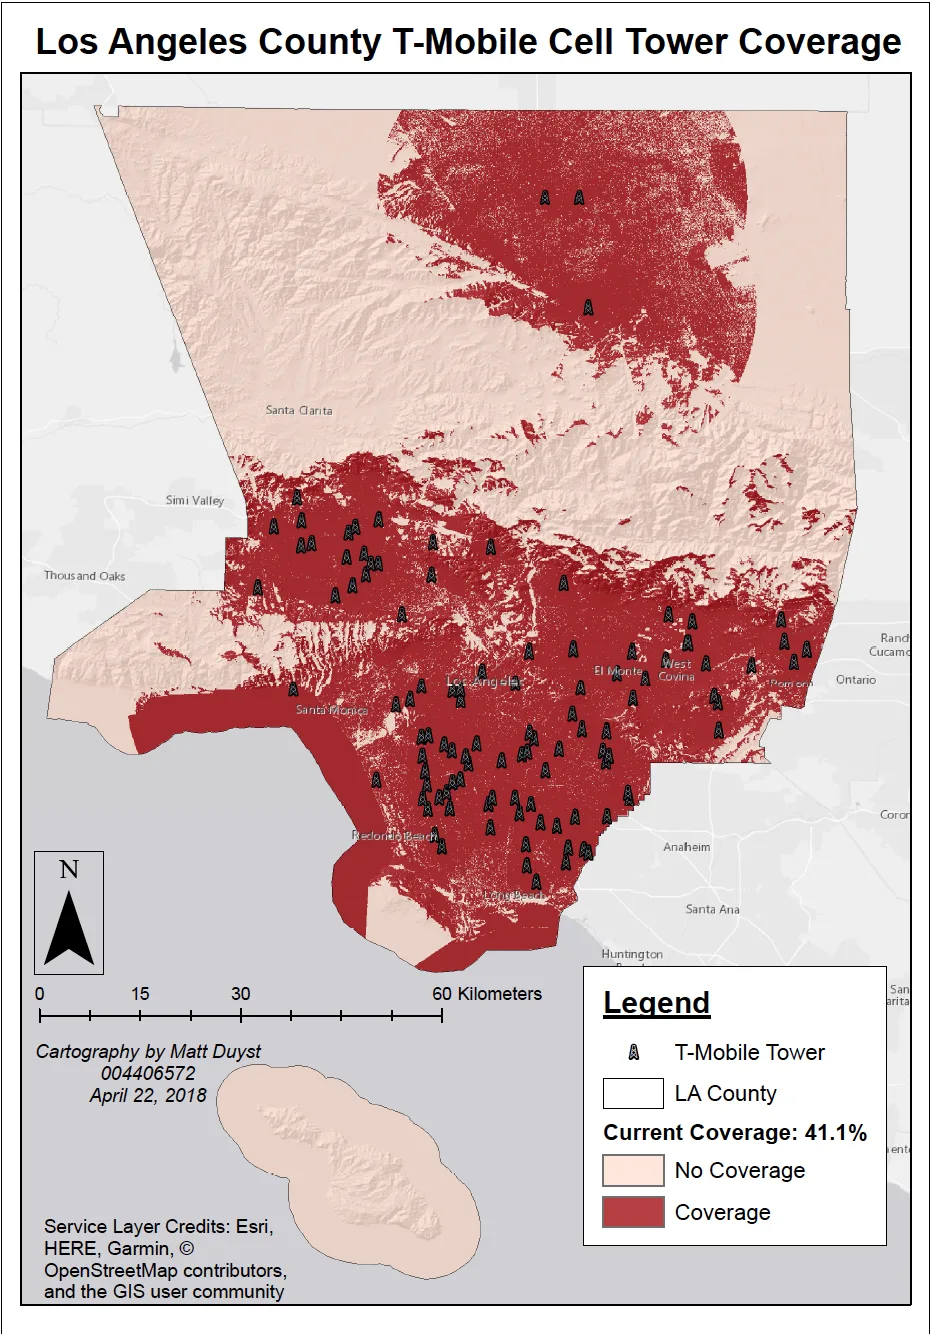
Modifications of T-Mobile Cell Towers for Accentuated Coverage Areas: Los Angeles, CA 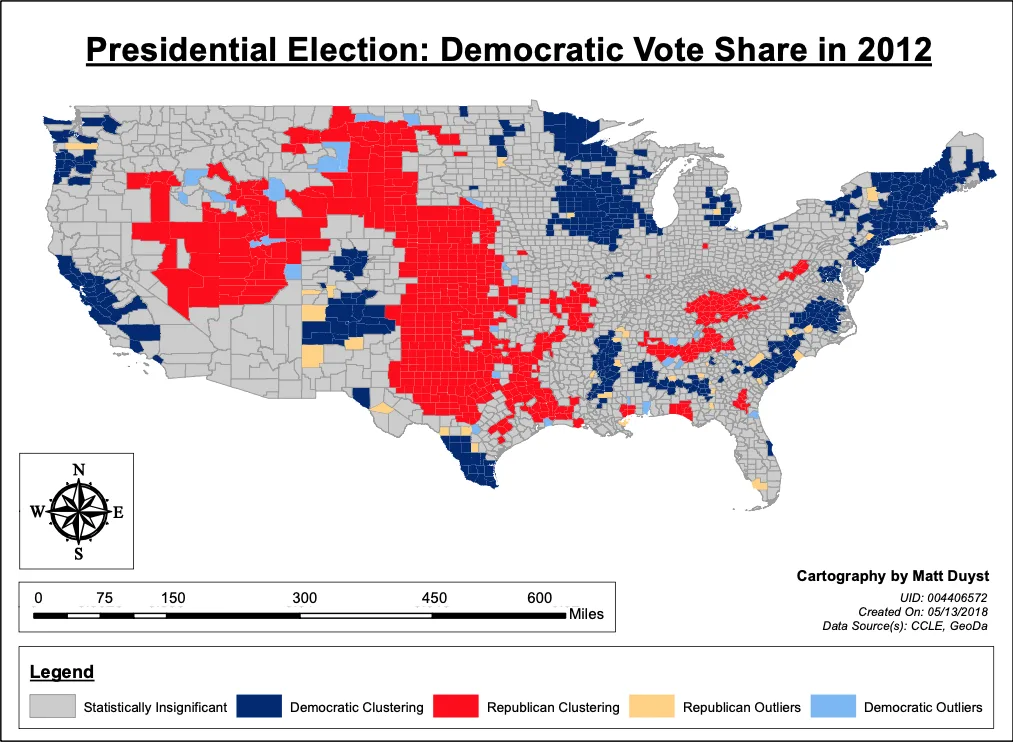 Interpolation
The Spatial Dynamics of Presidential Elections: An Autocorrelation Analysis of Voter Behavior in 2012 & 2016 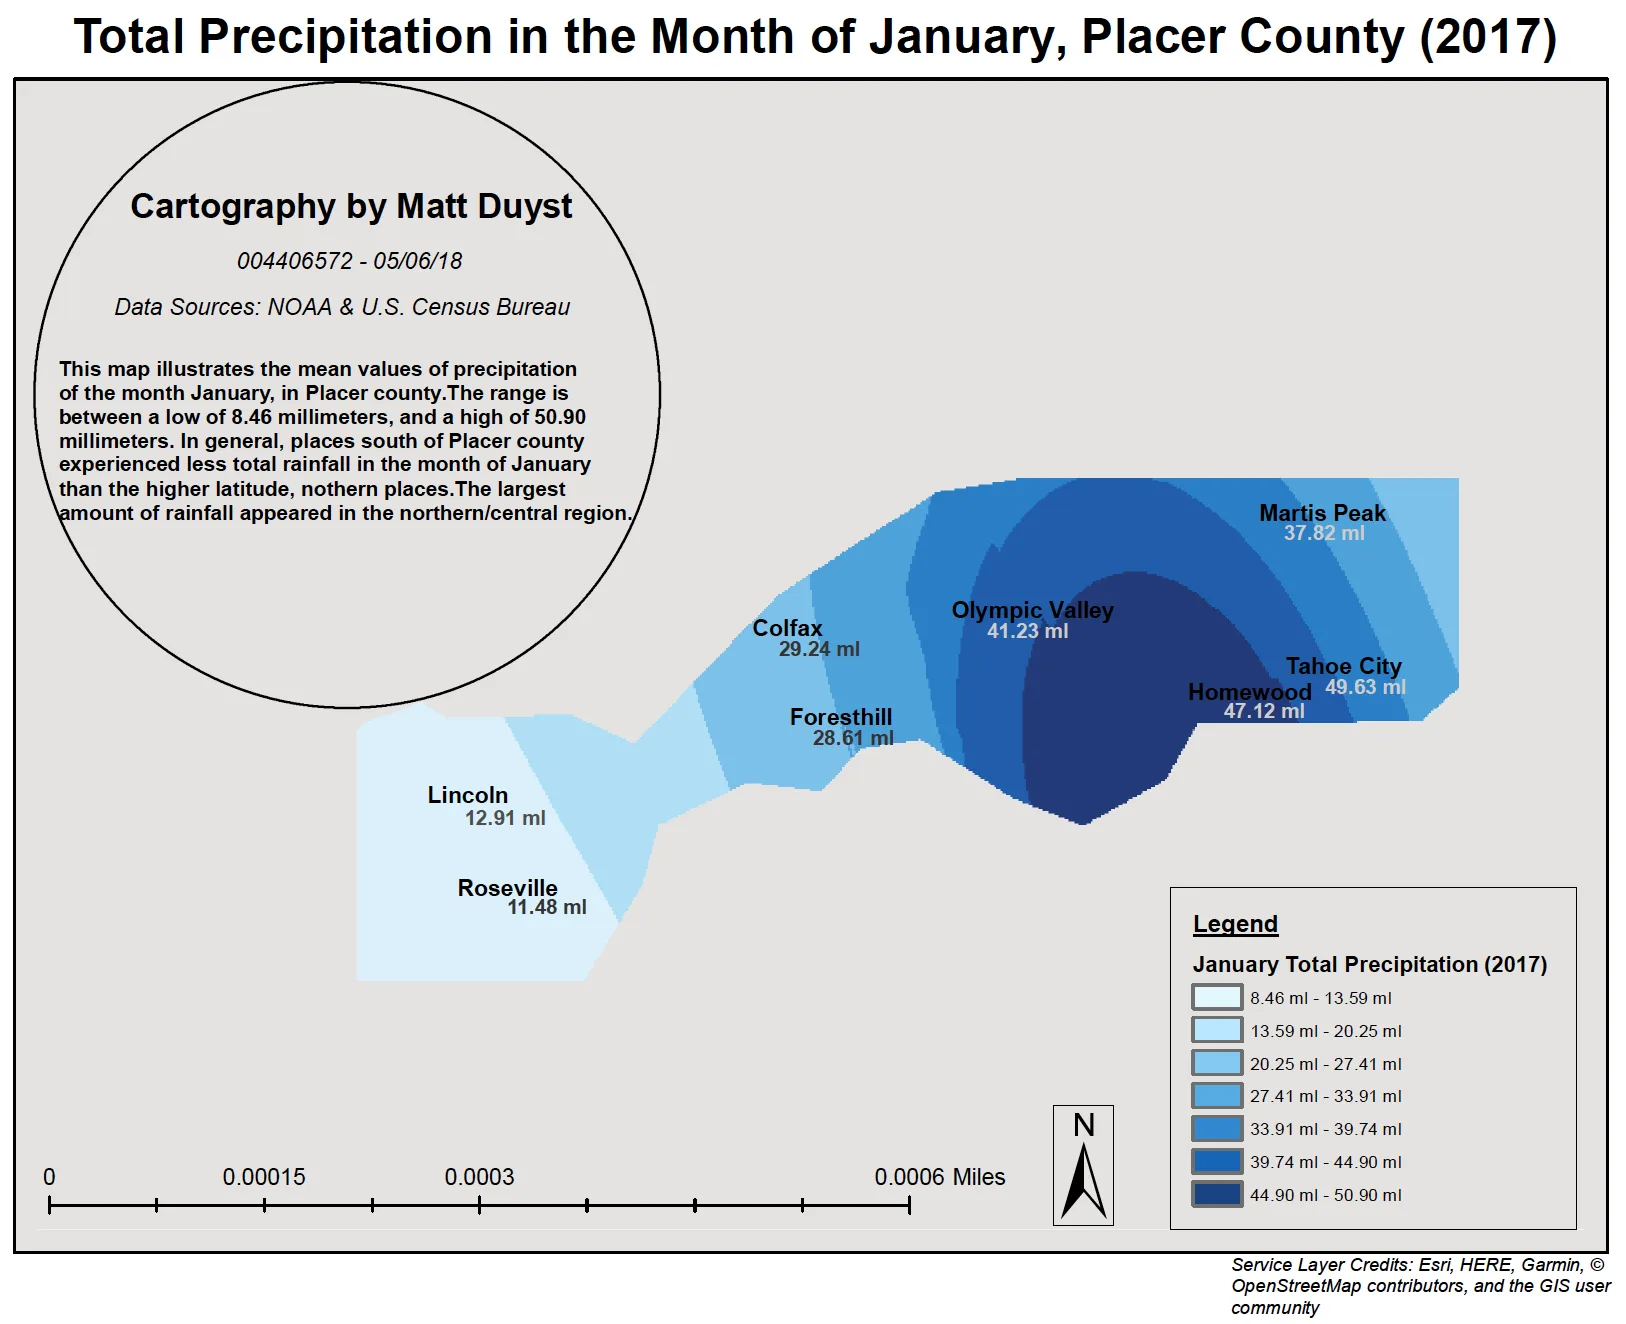
Precipitation Calculations of Ski Resorts in Placer County, CA 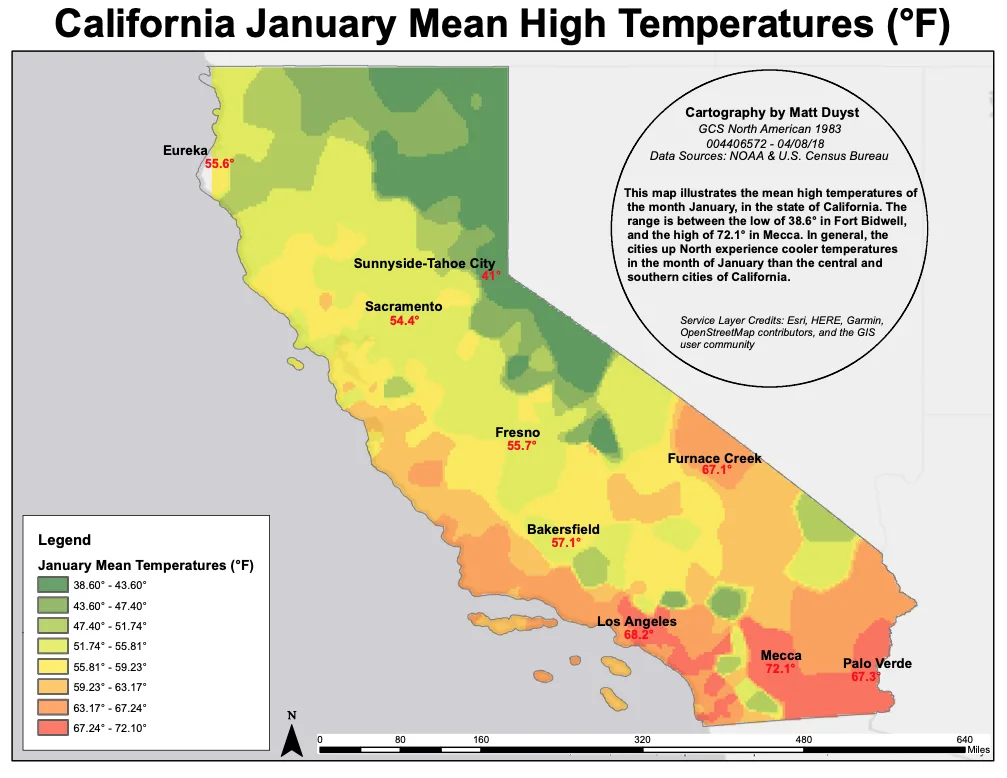
Statewide Precipitation Averages: California 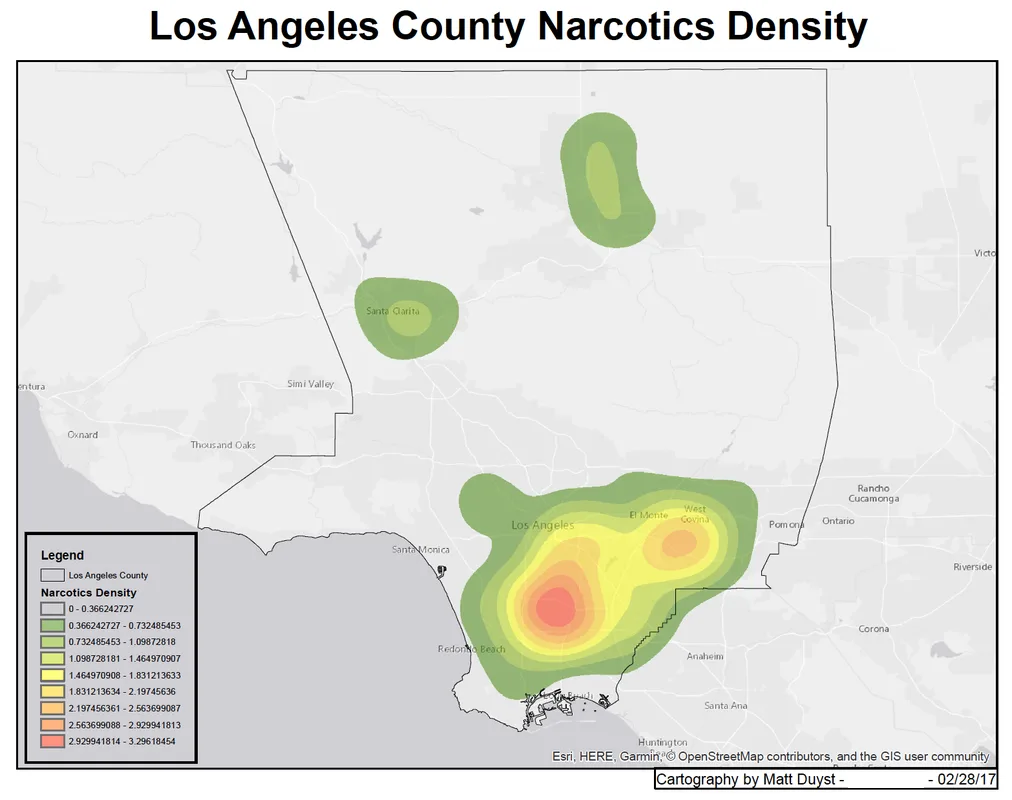 Density Mapping
LA County Criminal Mappings: Heat Mapping & Thiessen Polygons of Reported Crimes - Source sheet not reproducedDigitizing
Revitilization of a Sanborn Map: Digitizing Hollywood District
Remote Sensing · 1 of 31
Where the work happened.
As one of three scientists on the Science team, reporting to the co-founder and CTO, I led a quantitative assessment of flare destruction removal efficiency across the Bakken and Permian basins. The result covered 42 flare systems across 71 observations, including 27 revisits, and was published as first author and presented at SPE ATCE 2024 (SPE-221067-MS), contributing to enhanced leak detection and repair programs in two major shale basins. I trained a fine-tuned YOLOv8 detector to classify wellheads, compressors, storage tanks, and flare stacks from aerial imagery for autonomous site characterization, managing the full cycle from annotation to held-out validation, and built the client-facing and internal visualization suites in Python and GIS platforms that communicated spatial emissions distributions across survey campaigns.
In the Lee Lab I investigated the relationship between urbanization, rice cultivation, and methane across China's Yangtze River Delta, home to more than 150 million people: multi-decadal land cover classified from 30 m Landsat in Google Earth Engine, with urban extent from the GAIA dataset and paddy rice from the Phenology and Pixel-Based Paddy Mapping algorithm, set against Sentinel-5P TROPOMI column methane and tested for spatial clustering with Getis-Ord Gi* and Global Moran's I. The thesis proposed a DeepLabV3+ network to extend the emissions record before the satellite era. A 2026 reproduction of the analysis does not reach the thesis conclusion: no land-cover model outperforms a spatial null at 0.25 degrees, and both the original thesis and the reproduction are published together with an errata.
The 2022 work applied feature importance and seasonal decomposition to isolate the environmental drivers of flux and built an ensemble of LightGBM, SARIMAX, Prophet, and XGBoost over OLS regression; soil temperature was the strongest signal, with a Pearson r of 0.87 with methane flux, and the ordinary least squares regression yielded an R² of 0.78. The project was rebuilt from source in 2026 as a monthly study of the full 2009 to 2024 record, forecasting one to twelve months ahead against seasonal benchmarks and projecting the fitted relationships back two decades. The rebuilt finding is narrower and more useful: the seasonal cycle repeats reliably, the size of each season varies without trend, and none of the recorded covariates predict that variation once seasonality is accounted for.
The coursework covered the full geospatial stack: supervised and unsupervised image classification, spectral index analysis, SAR interpretation, DEM construction, spatial interpolation and autocorrelation, SQL spatial querying, cartographic design, and predictive environmental modeling. The undergraduate thesis measured surface vegetation change across the Mendocino Complex, at the time the largest wildfire in California history, from Landsat 8 pre- and post-fire scenes in Google Earth Engine using NDVI and NBR, and was presented at the 2019 Los Angeles Geospatial Summit, hosted by the USC Spatial Sciences Institute.
Research themes.
Measuring what you cannot see directly
Methane from a satellite column, biomass from reflectance, combustion from a plume. Every project infers a quantity the instrument never touches, and has to say how well.
Two sources rarely agree
Satellites, drones, towers, and field samples were each built for their own purpose, at their own resolution and revisit. Everything downstream rests on reconciling them into one measurement you can rely on.
Ground the model was never trained on
What happens when a model leaves its training region, year, or ecosystem, and whether it can be honest about where it cannot answer. Physics-constrained structure and foundation models are the two levers.
Checkable science
A result earns trust by being reproducible, not by who produced it. Each project is published with its code, and its data where they can be shared, and an errata where the reproduction disagrees with the original.